本指標の推計で使用する企業の財務データは、経済産業省「企業活動基本調査」、中小企業庁「中小企業実態基本調査」、財務省「法人企業統計調査」から取得している。推計に当たっては、法人番号をキーとして同一企業の複数年のデータを接合するため、法人番号の情報が必要であることから、「中小企業実態基本調査」は2016年度以降、「法人企業統計調査」は2018年度以降のデータを使用している。また、永久企業番号をキーとしてデータ接合を行った「企業活動基本調査」は、2016年度以降のデータを使用している。なお、最新時点はいずれも2022年度である。加えて、生産関数の推計式における各変数のデフレーターとして、内閣府「国民経済計算」の経済活動別のデフレーターを使用している。
上記の手法により推計されたマークアップ率を企業規模別・業種別に見ると、「製造業」、「非製造業」共に、「中小企業」に比べて「大企業」のマークアップ率の方が高い水準で推移していることが分かる。このことから、「中小企業」は「大企業」と比べて、費用変動に応じた適切な価格設定や価格転嫁が十分に進んでいない可能性があると考えられる。また、マークアップ率の水準を業種別に比較すると、「製造業」が「非製造業」よりも高い水準で推移しており、製造業では競合他社との差別化や市場環境を意識した価格設定、生産プロセスの改善による費用低減等が、非製造業よりも進んでいると示唆される(コラム1-1-7③図)。
コラム
1-1-7③図
マークアップ率の推移(企業規模別、業種別)
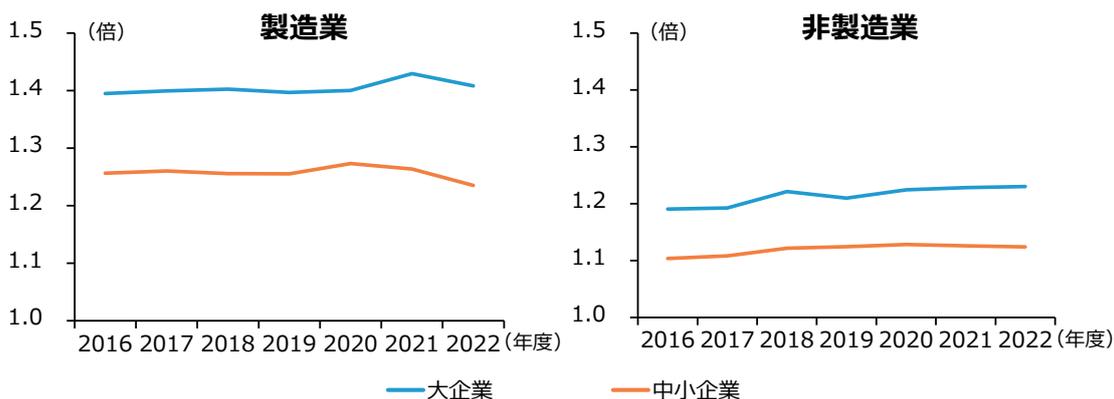
| 業種 | 企業規模 | 2016 | 2017 | 2018 | 2019 | 2020 | 2021 | 2022 |
|---|---|---|---|---|---|---|---|---|
| 製造業 | 大企業 | 1.40 | 1.40 | 1.40 | 1.40 | 1.40 | 1.42 | 1.40 |
| 中小企業 | 1.25 | 1.25 | 1.25 | 1.25 | 1.27 | 1.26 | 1.23 | |
| 非製造業 | 大企業 | 1.18 | 1.18 | 1.21 | 1.20 | 1.21 | 1.22 | 1.22 |
| 中小企業 | 1.10 | 1.11 | 1.12 | 1.12 | 1.12 | 1.12 | 1.12 |
資料:経済産業省「企業活動基本調査」再編加工、中小企業庁「中小企業実態基本調査」再編加工、財務省「法人企業統計調査年報」再編加工、内閣府「国民経済計算」
(注) 1. ここでの中小企業とは、中小企業基本法第2条第1項の規定に基づく「中小企業者」を指し、大企業とは、中小企業以外の企業を指す。
2. 企業規模別・業種(中分類)別に推計した個社ごとのマークアップ率を積み上げることで、製造業・非製造業のそれぞれにおける数値を算出している。