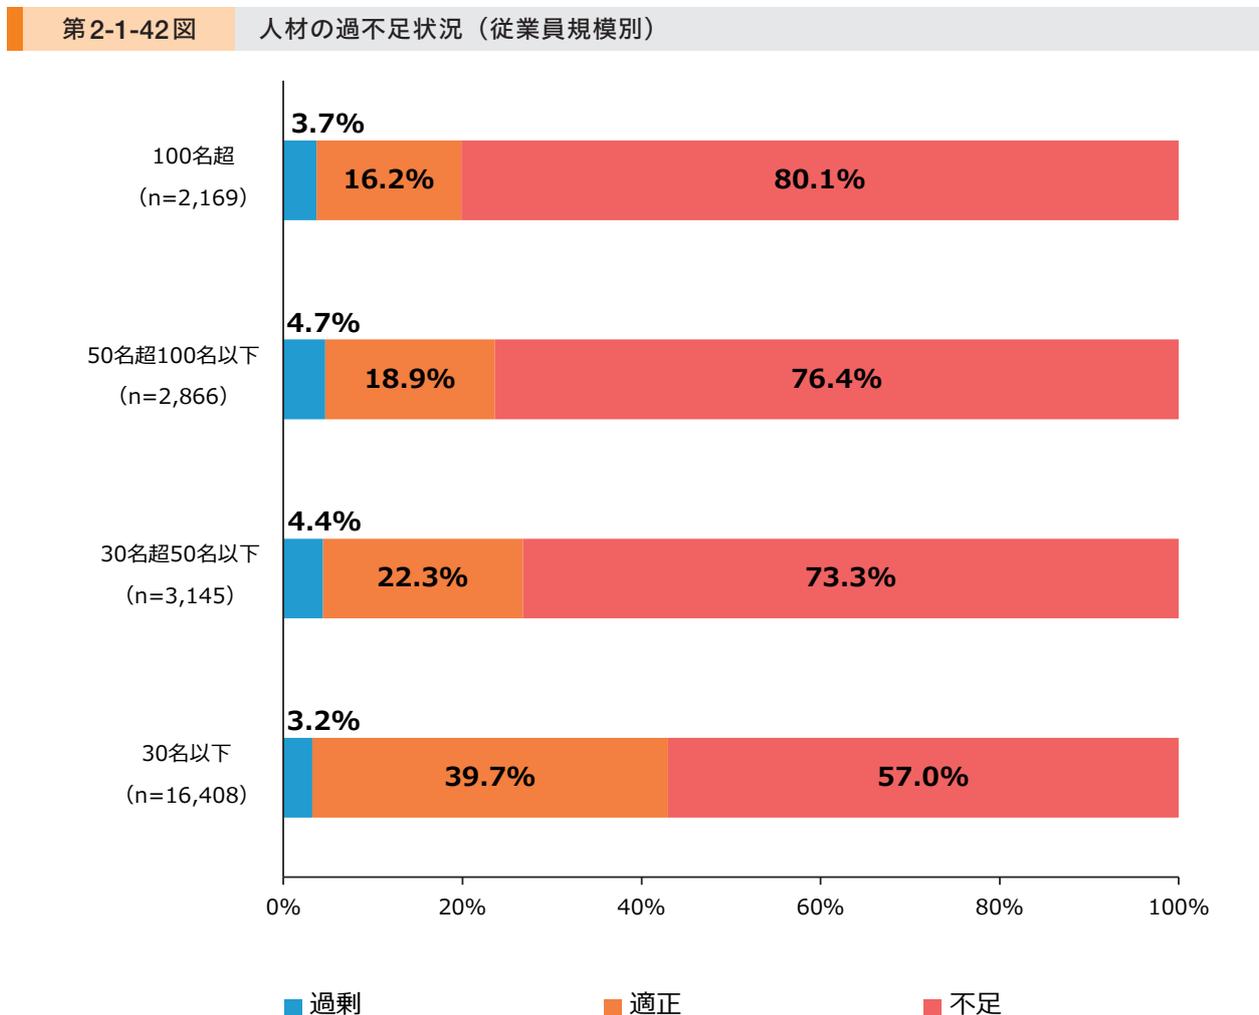
第2-1-42図は、従業員規模別に2024年の人材の過不足状況を見たものである。従業員規模が大きな事業者ほど人材不足を感じていることが分かる。
かる。特に、従業員数30名超の事業者では、人材の不足感が強くなる傾向にあることが分かる。
| 従業員規模 | 過剰 | 適正 | 不足 |
|---|---|---|---|
| 100名超 (n=2,169) | 3.7% | 16.2% | 80.1% |
| 50名超100名以下 (n=2,866) | 4.7% | 18.9% | 76.4% |
| 30名超50名以下 (n=3,145) | 4.4% | 22.3% | 73.3% |
| 30名以下 (n=16,408) | 3.2% | 39.7% | 57.0% |
Horizontal stacked bar chart titled '第2-1-42図 人材の過不足状況(従業員規模別)'. The chart shows the percentage of companies reporting 'Overstaffed' (blue), 'Appropriate' (orange), and 'Shortage' (red) by employee size. The x-axis represents percentages from 0% to 100%.
資料:(株)帝国データバンク「令和6年度中小企業の経営課題と事業活動に関する調査」
(注)1.2024年の人材の過不足状況について、「過剰」は「過剰」、「やや過剰」と回答した事業者の合計。「不足」は「不足」、「やや不足」と回答した事業者の合計。
2.ここでの従業員数は、2024年に常時雇用する正社員、パート・アルバイトの人数について聞いたもの。