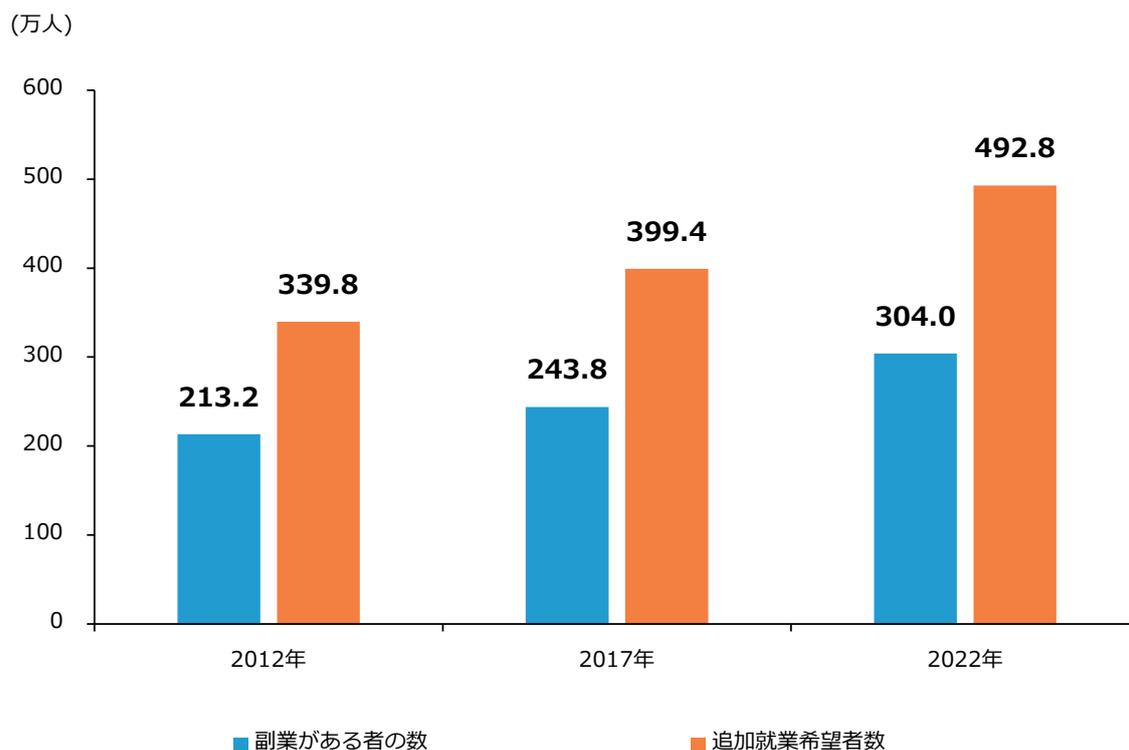
人材確保に有効な可能性がある副業人材の活用について確認する。第2-1-52図は、総務省「就業構造基本調査」を用いて「副業がある者の数」及び「追加就業希望者数」の推移を見たものである。
る。「副業がある者の数」、副業を希望している「追加就業希望者数」は共に、10年間で増加していることが分かる。
第2-1-52図 副業がある者の数及び追加就業希望者数の推移
(万人)
| 年 | 副業がある者の数 (万人) | 追加就業希望者数 (万人) |
|---|---|---|
| 2012年 | 213.2 | 339.8 |
| 2017年 | 243.8 | 399.4 |
| 2022年 | 304.0 | 492.8 |
■ 副業がある者の数 ■ 追加就業希望者数
Bar chart showing the number of people with side jobs and additional employment hopes in 2012, 2017, and 2022. The y-axis represents the number in thousands, ranging from 0 to 600. The x-axis shows the years. Blue bars represent '副業がある者の数' (Number of people with side jobs) and orange bars represent '追加就業希望者数' (Number of additional employment hopes).
資料:総務省「就業構造基本調査」
(注) 1. 有業者のうち本業の産業が「農業、林業」、「漁業」、「分類不能の産業」以外の者を集計している。
2. ここでの「副業」とは、主な仕事以外に就いている仕事を指す。
3. ここでの「追加就業希望者」とは、現在就いている仕事を続けながら、他の仕事もしたいと思っている者を指す。