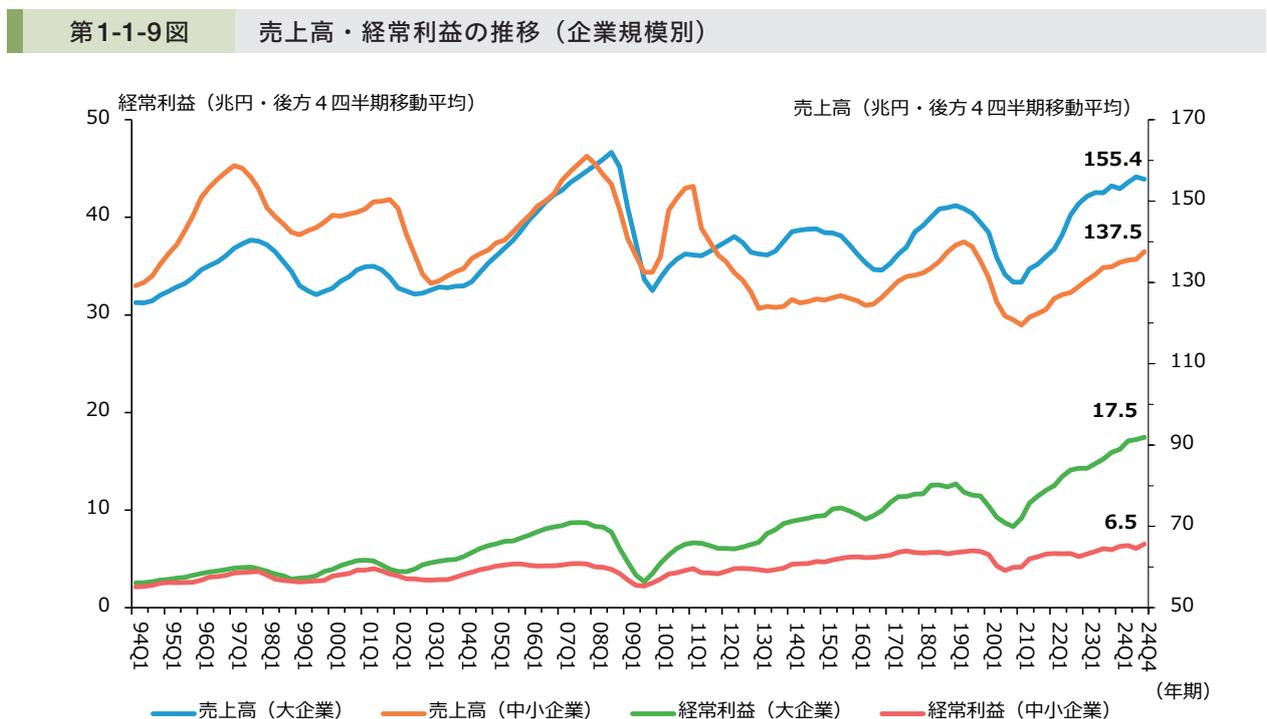
第1-1-9図は、企業規模別に売上高・経常利益の推移を見たものである。これを見ると、「売上高(中小企業)」は、2021年第1四半期を底に増加傾向にあり、足下は増加幅に縮小が見られるものの、引き続き増加傾向が続いている。また、「経常利益(中小企業)」は、2020年第3四半期を底に増加傾向で推移しているが、大企業と比較して伸び悩んでおり、その差は拡大傾向にある。
また、中小企業における経常利益の推移を業種
別に見ると傾向の違いが見て取れる。2010年からの推移を見ると、「建設業」などは上昇傾向で推移している一方、「宿泊業、飲食サービス業」などでは伸び悩んでいることが分かる(第1-1-10図)。
第1-1-11図を見ると、「小規模企業」では、売上高、経常利益共に足下において緩やかな増加傾向であることが見て取れる。
| 項目 | 2024Q1 (年) |
|---|---|
| 売上高(大企業) (兆円・後方4四半期移動平均) | 155.4 |
| 売上高(中小企業) (兆円・後方4四半期移動平均) | 137.5 |
| 経常利益(大企業) (兆円・後方4四半期移動平均) | 17.5 |
| 経常利益(中小企業) (兆円・後方4四半期移動平均) | 6.5 |
Line chart titled '第1-1-9図 売上高・経常利益の推移(企業規模別)'. It shows four data series from 2014Q1 to 2024Q1: Sales of Large Enterprises (blue), Sales of Small and Medium Enterprises (orange), Ordinary Income of Large Enterprises (green), and Ordinary Income of Small and Medium Enterprises (red). The left Y-axis represents Ordinary Income (0-50 billion yen) and the right Y-axis represents Sales (50-170 billion yen). The chart shows that while sales for both groups have grown, ordinary income for SMEs has lagged behind large enterprises.
資料:財務省「法人企業統計調査季報」
(注) 1.ここでの大企業とは資本金10億円以上の企業、中小企業とは資本金1千万円以上1億円未満の企業とする。
2.金融業、保険業は含まない。