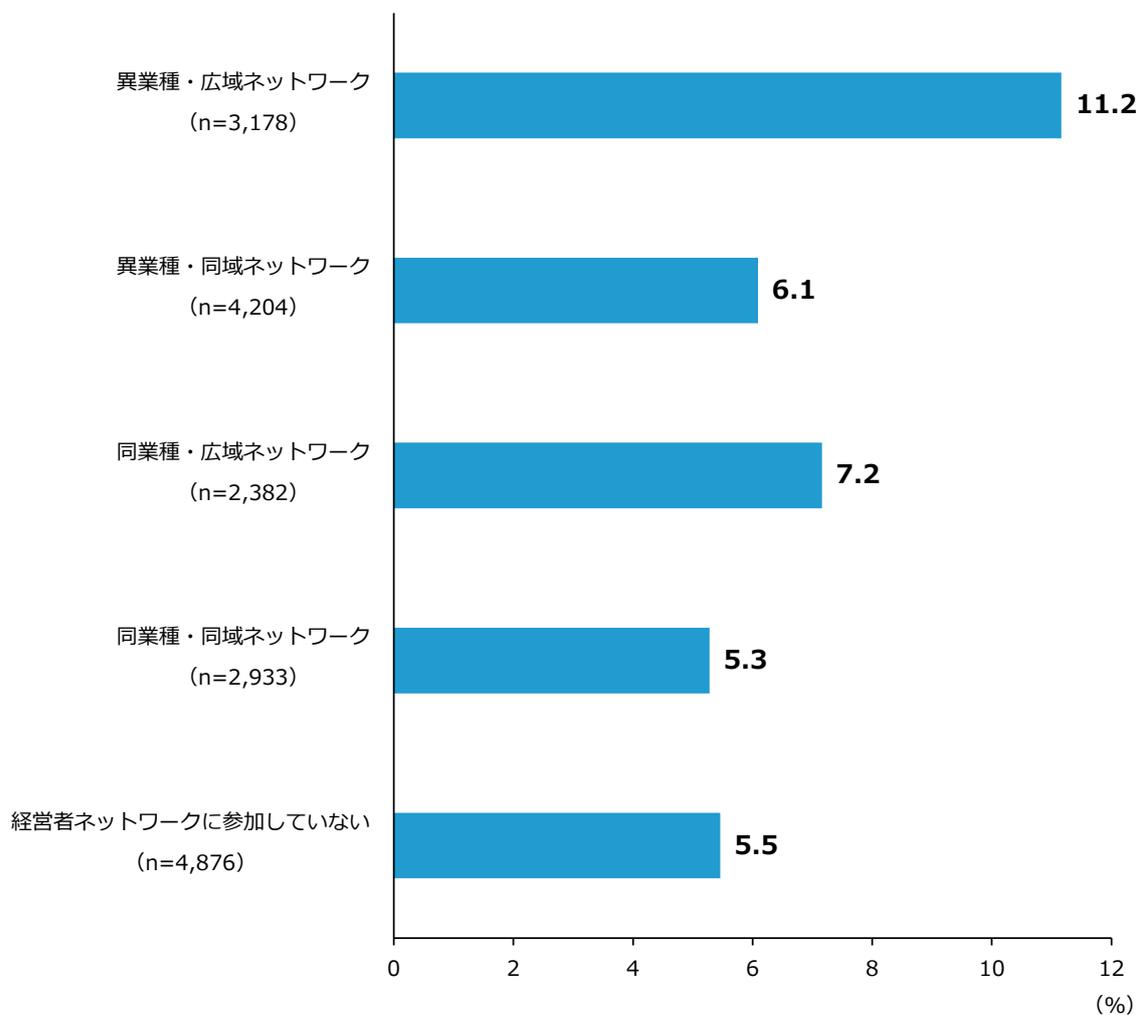
第2-1-80図は、最も頻繁に参加している経営者ネットワークの属性別に、事業者の売上高の変化率(中央値)を見たものである。特に「異業種・広域ネットワーク」は他のネットワークと比べて高い水準であることが分かる。また、「同業
種・広域ネットワーク」も比較的高い水準にある。この調査結果から一概にはいえないが、これまで述べてきたような経営者の成長意欲の高まりが、結果として売上高の成長につながっている可能性がある。
第2-1-80図 売上高の変化率(経営者ネットワークの参加状況・属性別、中央値)
A horizontal bar chart showing the median sales growth rate for different types of business networks. The y-axis lists five categories with their sample sizes in parentheses. The x-axis shows the growth rate in percentage from 0 to 12. The bars are blue, and the exact percentage value is displayed at the end of each bar.
| ネットワーク属性 | サンプル数 (n) | 売上高の変化率 (%) |
|---|---|---|
| 異業種・広域ネットワーク | 3,178 | 11.2 |
| 異業種・同域ネットワーク | 4,204 | 6.1 |
| 同業種・広域ネットワーク | 2,382 | 7.2 |
| 同業種・同域ネットワーク | 2,933 | 5.3 |
| 経営者ネットワークに参加していない | 4,876 | 5.5 |
Horizontal bar chart showing sales growth rates by network type.
資料:(株)帝国データバンク「令和6年度中小企業の経営課題と事業活動に関する調査」
(注)売上高の変化率は、2023年と2018年を比較して算出したもの。