次に、2013年度から2022年度までの10年間における、スケールの変動状況を確認していく。第2-2-6図におけるスケールを基に、10年間で1段階以上スケールが上方遷移した場合を「スケールアップ」、スケールの変動がない場合を
「維持」、下方遷移した場合を「スケールダウン」と定義する(第2-2-7図)。
スケールの変動状況は第2-2-8図のとおりで、約3社に1社がスケールアップを実現していることが分かる。
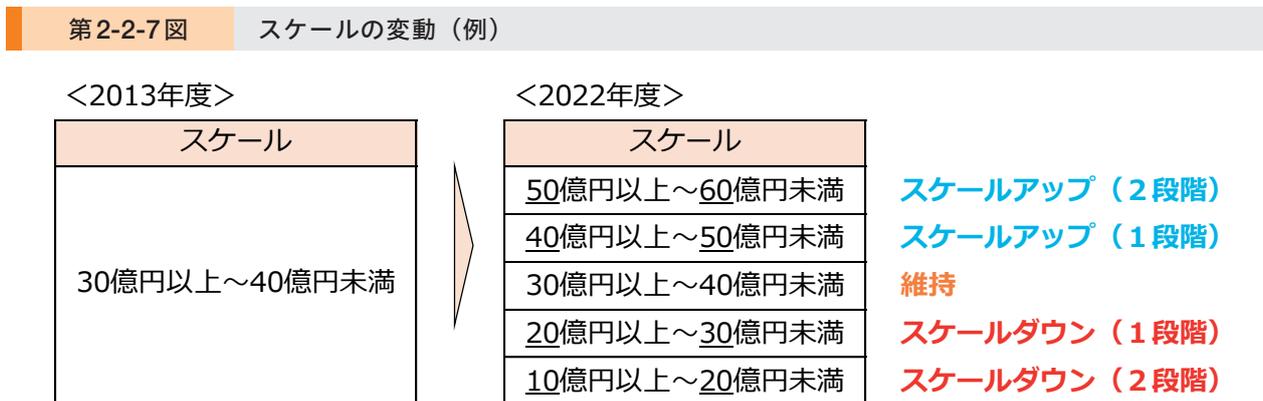
第2-2-7図 スケールの変動(例)
| <2013年度> | <2022年度> | |
|---|---|---|
| スケール | スケール | |
| 30億円以上~40億円未満 | 50億円以上~60億円未満 | スケールアップ(2段階) |
| 40億円以上~50億円未満 | スケールアップ(1段階) | |
| 30億円以上~40億円未満 | 維持 | |
| 20億円以上~30億円未満 | スケールダウン(1段階) | |
| 10億円以上~20億円未満 | スケールダウン(2段階) |
Diagram illustrating scale changes from 2013 to 2022. A box for 2013 shows '30億円以上~40億円未満'. An arrow points to a 2022 scale table with five levels. The levels are: 50億円以上~60億円未満 (Scale Up 2 steps), 40億円以上~50億円未満 (Scale Up 1 step), 30億円以上~40億円未満 (Maintain), 20億円以上~30億円未満 (Scale Down 1 step), and 10億円以上~20億円未満 (Scale Down 2 steps).
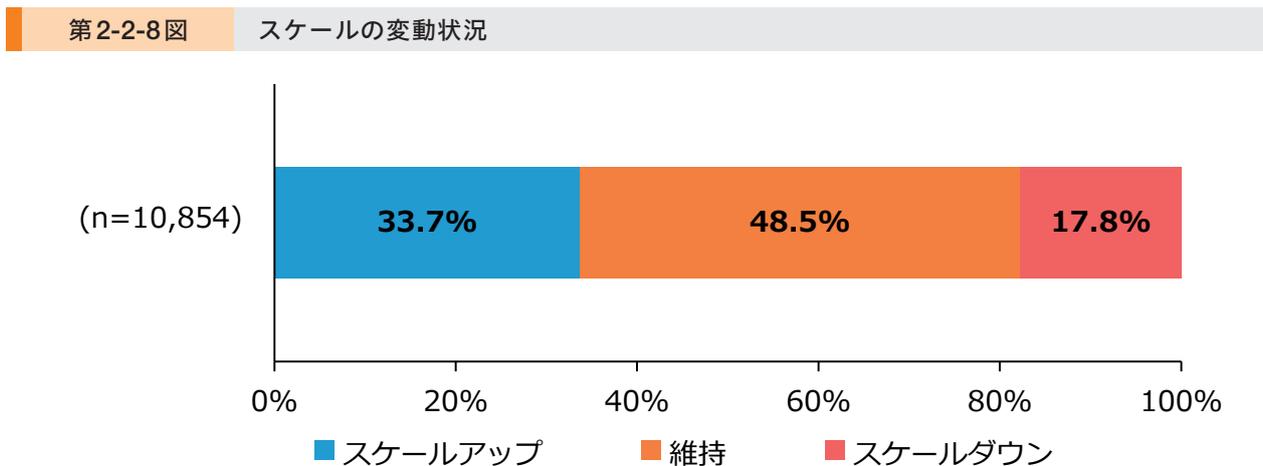
第2-2-8図 スケールの変動状況
| 状況 | 割合 |
|---|---|
| スケールアップ | 33.7% |
| 維持 | 48.5% |
| スケールダウン | 17.8% |
Stacked bar chart showing scale change status for n=10,854. The chart is divided into three segments: Scale Up (33.7%, blue), Maintain (48.5%, orange), and Scale Down (17.8%, red).
資料:経済産業省「企業活動基本調査」再編加工
(注) パネルデータを基に算出している。パネルデータの詳細は、第2部第2章第2節冒頭の脚注を参照。