第1-1-15図は、企業規模別に有利子資産利子率及び有利子負債利子率を見たものである。金利の上昇局面では、支払利息の増加による利益の下押しだけでなく、資産運用において受取利息等の
増加がもたらす恩恵もあると考えられる。しかし、「中小企業」は「大企業」に比べて有利子資産保有量が少なく、その恩恵を受けにくい構造にあるといえる。
第1-1-15図 有利子資産利子率・有利子負債利子率(企業規模別)
(1)有利子資産利子率
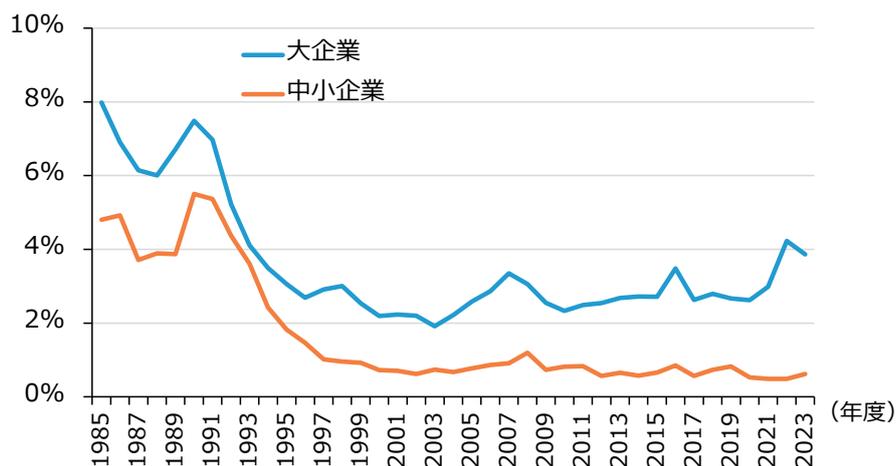
| 年度 | 大企業 (%) | 中小企業 (%) |
|---|---|---|
| 1985 | 8.0 | 4.8 |
| 1987 | 6.0 | 4.0 |
| 1989 | 6.0 | 4.0 |
| 1991 | 7.5 | 5.5 |
| 1993 | 4.0 | 3.5 |
| 1995 | 3.0 | 2.0 |
| 1997 | 2.5 | 1.0 |
| 1999 | 3.0 | 1.0 |
| 2001 | 2.0 | 0.8 |
| 2003 | 2.0 | 0.8 |
| 2005 | 2.5 | 0.8 |
| 2007 | 3.5 | 1.0 |
| 2009 | 2.5 | 0.8 |
| 2011 | 2.5 | 0.8 |
| 2013 | 2.5 | 0.8 |
| 2015 | 2.5 | 0.8 |
| 2017 | 3.5 | 0.8 |
| 2019 | 2.5 | 0.8 |
| 2021 | 2.5 | 0.8 |
| 2023 | 4.0 | 0.8 |
Line chart showing Interest Rate on Interest-Earning Assets for Large Enterprises (blue line) and Small and Medium Enterprises (orange line) from 1985 to 2023. The Y-axis represents the interest rate from 0% to 10%.
(2)有利子負債利子率
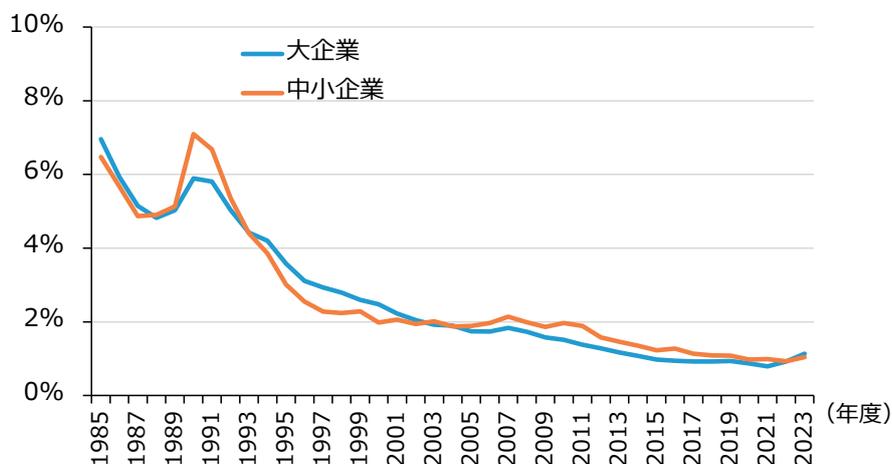
| 年度 | 大企業 (%) | 中小企業 (%) |
|---|---|---|
| 1985 | 7.0 | 6.5 |
| 1987 | 5.0 | 5.0 |
| 1989 | 5.0 | 5.0 |
| 1991 | 6.0 | 7.0 |
| 1993 | 4.0 | 4.0 |
| 1995 | 3.0 | 3.0 |
| 1997 | 2.5 | 2.0 |
| 1999 | 2.5 | 2.0 |
| 2001 | 2.0 | 2.0 |
| 2003 | 2.0 | 2.0 |
| 2005 | 1.8 | 1.8 |
| 2007 | 1.8 | 2.0 |
| 2009 | 1.5 | 1.8 |
| 2011 | 1.5 | 1.8 |
| 2013 | 1.2 | 1.5 |
| 2015 | 1.0 | 1.2 |
| 2017 | 1.0 | 1.2 |
| 2019 | 1.0 | 1.0 |
| 2021 | 0.8 | 1.0 |
| 2023 | 1.0 | 1.0 |
Line chart showing Interest Rate on Interest-Bearing Liabilities for Large Enterprises (blue line) and Small and Medium Enterprises (orange line) from 1985 to 2023. The Y-axis represents the interest rate from 0% to 10%.
資料:財務省「法人企業統計調査季報」
(注)1.ここでの大企業とは資本金10億円以上、中小企業とは資本金1千万円以上1億円未満の企業とする。
2.金融業・保険業を含まない。
3.有利子資産利子率=受取利息等(配当金含む)÷(現金・預金+公社債+長期貸付金+株式)。
4.有利子負債利子率=支払利息等÷(金融機関借入金+その他の借入金+社債+受取手形割引残高(期首・期末平均))。