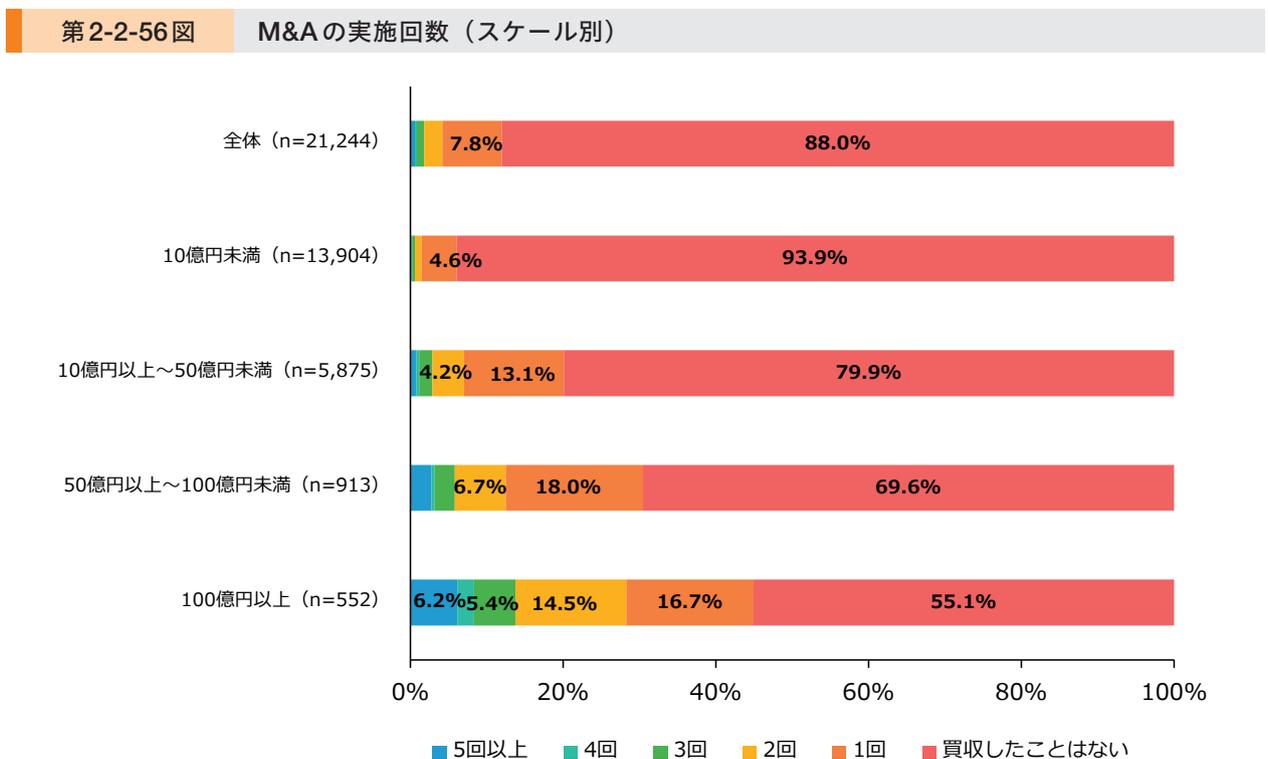
第2-2-56図は、M & Aの実施回数について、スケール別に確認したものである。これを見ると、スケールが大きい事業者ほど実施回数が多い傾向にあることが分かる。これらの調査結果から
一概にはいえないが、スケールアップに向けた成長戦略として、M & Aは有効である可能性がうかがえる。
| スケール別 | 5回以上 | 4回 | 3回 | 2回 | 1回 | 買収したことはない |
|---|---|---|---|---|---|---|
| 全体 (n=21,244) | 0.0% | 0.0% | 0.0% | 7.8% | 0.0% | 88.0% |
| 10億円未満 (n=13,904) | 0.0% | 0.0% | 0.0% | 4.6% | 0.0% | 93.9% |
| 10億円以上~50億円未満 (n=5,875) | 0.0% | 0.0% | 4.2% | 13.1% | 0.0% | 79.9% |
| 50億円以上~100億円未満 (n=913) | 6.2% | 5.4% | 0.0% | 14.5% | 16.7% | 69.6% |
| 100億円以上 (n=552) | 6.2% | 5.4% | 0.0% | 14.5% | 16.7% | 55.1% |
Horizontal stacked bar chart titled '第2-2-56図 M&Aの実施回数(スケール別)'. The chart shows the percentage distribution of M&A implementation frequency across different company size categories. The categories are: 全体 (n=21,244), 10億円未満 (n=13,904), 10億円以上~50億円未満 (n=5,875), 50億円以上~100億円未満 (n=913), and 100億円以上 (n=552). The frequency categories are: 5回以上 (blue), 4回 (teal), 3回 (green), 2回 (yellow), 1回 (orange), and 買収したことはない (red).
資料:(株)帝国データバンク「令和6年度中小企業の経営課題と事業活動に関する調査」
(注)1.組織形態について「法人」と回答した事業者聞いたもの。
2.ここでの「M&Aの実施」とは、他社又は他社事業を買収することを指す。なお、「他社の買収」とは議決権過半数に当たる株式を取得すること、「他社事業の買収」とは事業譲受のことを指す。いずれも有償・無償かは問わない。
3.ここでのスケールは、直近(1期前)の売上高に基づいて集計しており、1期前において「事業を開始していない」と回答した事業者は集計から除いている。