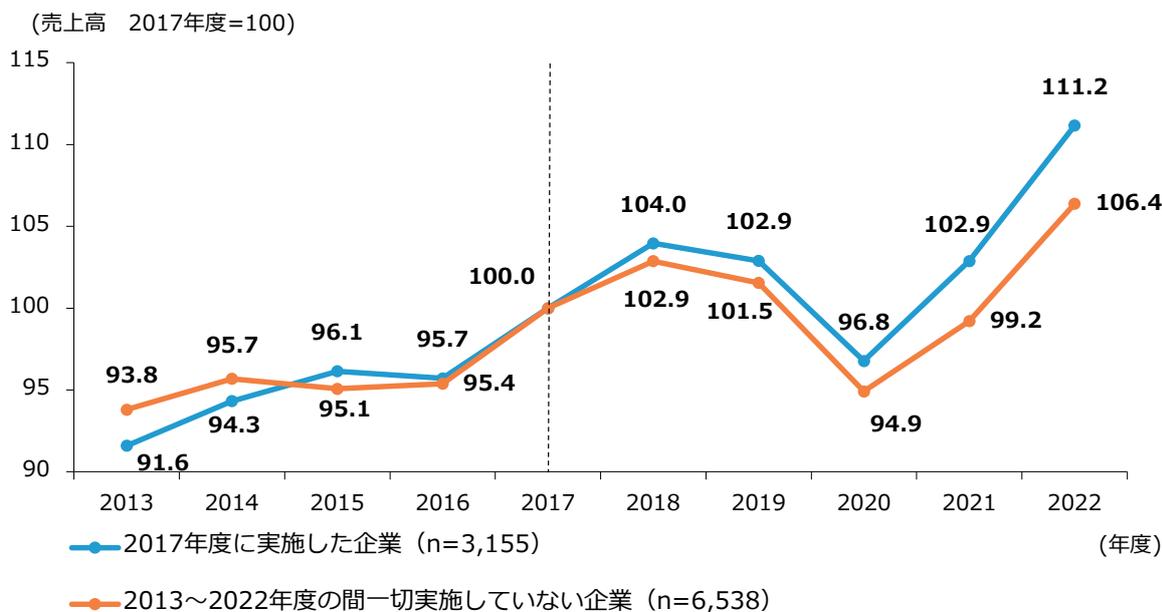
ここからは経済産業省「企業活動基本調査」のパネルデータを用いて、分析を進めていく。第2-2-71図は、研究開発投資の実施有無別に、売上高の推移を見たものである。研究開発投資につ
いて、「2017年度に実施した企業」は「2013~2022年度の間に一切実施していない企業」に比べて、2022年度における売上高の成長度合いが高いことが分かる。
第2-2-71図 売上高の推移(研究開発投資の実施有無別)
| 年度 | 2017年度に実施した企業 (n=3,155) | 2013~2022年度の間に一切実施していない企業 (n=6,538) |
|---|---|---|
| 2013 | 91.6 | 93.8 |
| 2014 | 94.3 | 95.7 |
| 2015 | 96.1 | 95.1 |
| 2016 | 95.7 | 95.4 |
| 2017 | 100.0 | 100.0 |
| 2018 | 104.0 | 102.9 |
| 2019 | 102.9 | 101.5 |
| 2020 | 96.8 | 94.9 |
| 2021 | 102.9 | 99.2 |
| 2022 | 111.2 | 106.4 |
Line chart showing sales index (2017=100) from 2013 to 2022 for two groups of companies: those that implemented R&D investment in 2017 (blue line) and those that did not implement it at all between 2013 and 2022 (orange line).
資料:経済産業省「企業活動基本調査」再編加工
- (注)1.パネルデータを基に算出している。パネルデータの詳細は、第2部第2章第2節冒頭の脚注を参照。
- 2.ここでいう「研究開発投資の実施」とは、「自社研究開発費」及び「委託研究開発費」の合計額が0(調査票上の単位はそれぞれ百万円)より大きい場合をいう。
- 3.2017年度の数値を100として比較した、2013年度から2022年度までの変化を見たもの。