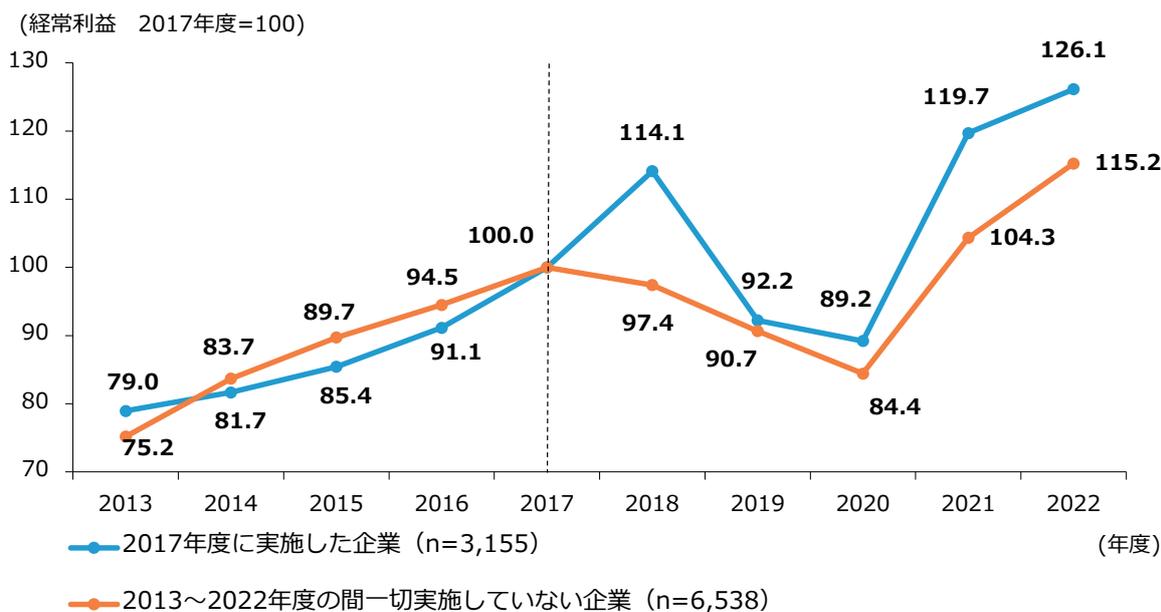
第2-2-73図は、研究開発投資の実施有無別に、経常利益の推移を見たものである。研究開発投資について、「2017年度に実施した企業」は「2013~2022年度の間に一切実施していない企業」に比べて、2022年度における経常利益の成長度合い
が高いことが分かる。研究開発投資による効果は、売上高の増加だけでなく、自社製品・商品・サービスの付加価値を高めること等により利益の増加にもつながる可能性がある。
第2-2-73図 経常利益の推移(研究開発投資の実施有無別)
| 年度 | 2017年度に実施した企業 (n=3,155) | 2013~2022年度の間に一切実施していない企業 (n=6,538) |
|---|---|---|
| 2013 | 79.0 | 75.2 |
| 2014 | 81.7 | 83.7 |
| 2015 | 85.4 | 89.7 |
| 2016 | 91.1 | 94.5 |
| 2017 | 100.0 | 100.0 |
| 2018 | 114.1 | 97.4 |
| 2019 | 92.2 | 90.7 |
| 2020 | 89.2 | 84.4 |
| 2021 | 119.7 | 104.3 |
| 2022 | 126.1 | 115.2 |
Line chart showing the trend of ordinary income (2017 fiscal year = 100) for two groups of companies from 2013 to 2022. The blue line represents companies that implemented R&D investment in 2017 (n=3,155), and the orange line represents companies that did not implement R&D investment at any point between 2013 and 2022 (n=6,538).
資料:経済産業省「企業活動基本調査」再編加工
(注) 1.パネルデータを基に算出している。パネルデータの詳細は、第2部第2章第2節冒頭の脚注を参照。
2.ここでいう「研究開発投資の実施」とは、「自社研究開発費」及び「委託研究開発費」の合計額が0(調査票上の単位はそれぞれ百万円)より大きい場合をいう。
3.2017年度の数値を100として比較した、2013年度から2022年度までの変化を見たもの。