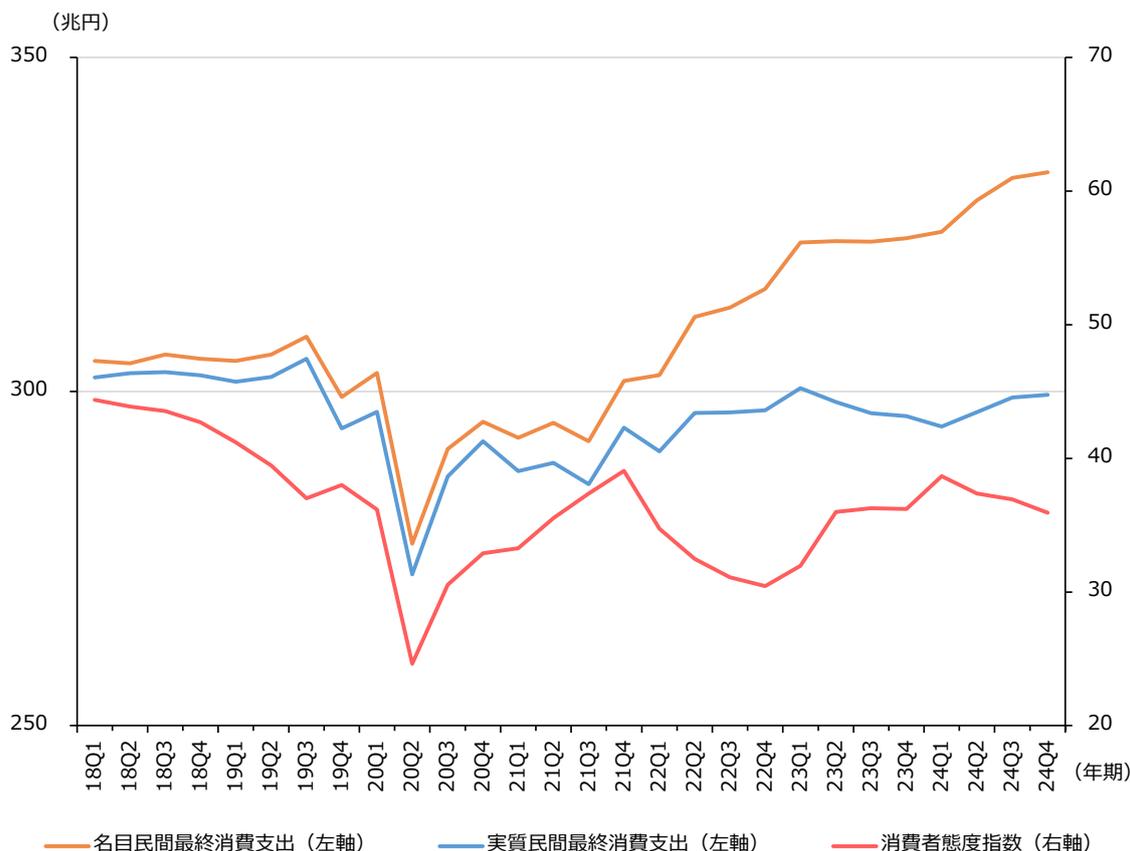
第1-1-20図は、民間最終消費支出及び消費者態度指数の推移を見たものである。足下の「名目民間最終消費支出」は上昇したものの、「実質民間最終消費支出」は伸び悩んでおり、「消費者態
度指数」も2024年第1四半期をピークに低下傾向にある。物価高等の影響は個人消費にも及び、こうした消費動向の変化を踏まえた経営判断が重要になってくるといえる。
第1-1-20図 民間最終消費支出、消費者態度指数の推移
The graph displays three data series from 2018 to 2024. The X-axis shows quarterly periods from 18Q1 to 24Q4. The left Y-axis (trillion yen) ranges from 250 to 350. The right Y-axis (index) ranges from 20 to 70. The orange line (nominal expenditure) shows a general upward trend, peaking around 340 trillion yen in 2024. The blue line (real expenditure) shows a more volatile pattern, peaking around 300 trillion yen in 2023. The red line (consumer sentiment index) shows a sharp decline in 2020, followed by a recovery and a peak in 2024.
| 四半期 | 名目民間最終消費支出 (左軸) (兆円) | 実質民間最終消費支出 (左軸) (兆円) | 消費者態度指数 (右軸) |
|---|---|---|---|
| 18Q1 | 305 | 300 | 45 |
| 18Q2 | 305 | 300 | 45 |
| 18Q3 | 305 | 300 | 45 |
| 18Q4 | 305 | 300 | 45 |
| 19Q1 | 305 | 300 | 45 |
| 19Q2 | 305 | 300 | 45 |
| 19Q3 | 310 | 305 | 45 |
| 19Q4 | 300 | 295 | 45 |
| 20Q1 | 305 | 295 | 45 |
| 20Q2 | 275 | 270 | 25 |
| 20Q3 | 290 | 285 | 30 |
| 20Q4 | 295 | 290 | 30 |
| 21Q1 | 290 | 285 | 30 |
| 21Q2 | 295 | 290 | 30 |
| 21Q3 | 290 | 285 | 30 |
| 21Q4 | 300 | 295 | 35 |
| 22Q1 | 305 | 295 | 35 |
| 22Q2 | 320 | 295 | 35 |
| 22Q3 | 325 | 295 | 35 |
| 22Q4 | 330 | 295 | 35 |
| 23Q1 | 340 | 300 | 35 |
| 23Q2 | 340 | 295 | 35 |
| 23Q3 | 340 | 295 | 35 |
| 23Q4 | 340 | 295 | 35 |
| 24Q1 | 340 | 295 | 35 |
| 24Q2 | 345 | 295 | 35 |
| 24Q3 | 350 | 295 | 35 |
| 24Q4 | 350 | 295 | 35 |
資料:内閣府「国民経済計算」「消費動向調査」
(注) 1.「名目民間最終消費支出」及び「実質民間最終消費支出」は、いずれも季節調整系列。
2.消費者態度指数は「二人以上の世帯」、原数値。四半期ごとの平均値を集計している。