コラム
1-1-5③図
時期別に見たネットワーク図
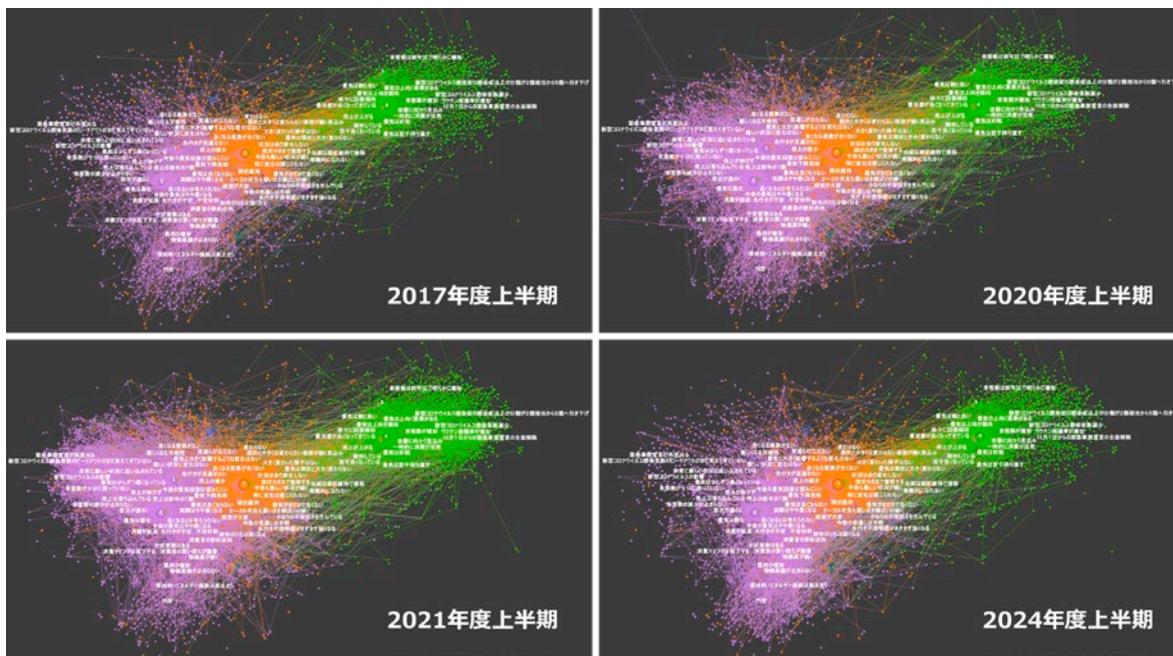
Four network diagrams showing the evolution of a network over time. The top-left diagram is labeled '2017年度上半期', the top-right '2020年度上半期', the bottom-left '2021年度上半期', and the bottom-right '2024年度上半期'. Each diagram shows a dense web of nodes (represented by small circles) and edges (represented by lines). The nodes are color-coded, with prominent clusters of green, orange, and purple nodes. The network appears to become more complex and interconnected over the period shown.
資料:内閣府「景気ウォッチャー調査」より中小企業庁作成
(注)1. 図中の点は「ノード」、矢印は「エッジ」を表す。
2. 図中の文字は、2017年4月から2024年11月までの全期間における代表的なノードの文言を抜粋して示したものの、いずれの時期でも同一の位置に表示されているが、当該時期に必ずしもその文言に当たるノードが確認されているとは限らない。
このような時期によるネットワークの違いを定量的に分析するため、期間ごとのネットワークの類似度を計算したものをコラム1-1-5④図に示す。(1)からは、ネットワークが1年から1年半程度は類似性を保持すること、また2020年度上半期がいずれの時期とも類似度が低く、特異な時期となっていることが明らかとなっている。2024年度下半期の特異性については、データ量が十分に蓄積されていないことが要因と考えられる。コラム1-1-5④図の(2)は、参考として、ネットワーク間の類似度を基に各時期をt分布型確率的近傍埋め込み法(t-distributed stochastic neighbor embedding、以下、「t-SNE」という 39 。)によって低次元化したものを示したものである。この図からは、時間的に近接する期間のネットワークが空間的にも近接して配置される傾向が明確に表れている。
39 詳細は、van der Maaten and Hinton(2008)による。