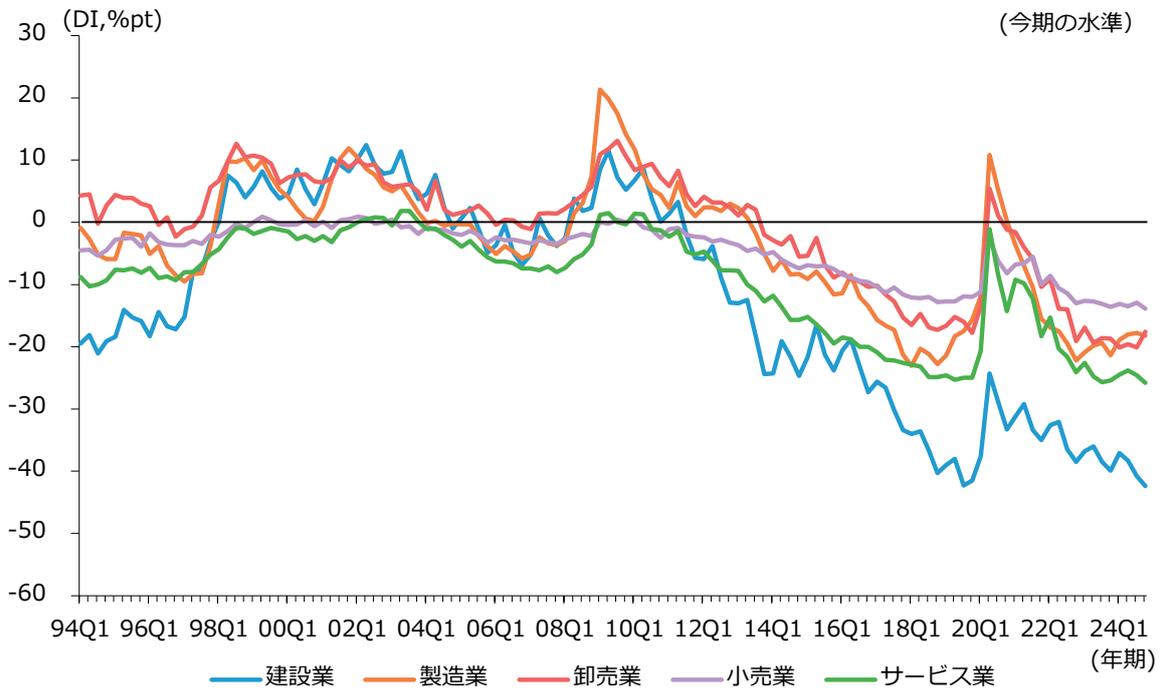
第1-1-23図 従業員数過不足DIの推移(業種別)
The chart displays the Employee Over/Understaffing DI (DI, %pt) for five industries from 1994 to 2024. The Y-axis represents the DI in percentage points, ranging from -60 to 30. The X-axis shows quarterly data from 1994 (94Q1) to 2024 (24Q1). A horizontal line at 0 indicates the 'current level' (今期の水準). The data shows significant fluctuations, with a notable sharp decline in the Construction industry (blue line) starting around 2012, reaching a low of approximately -45%pt in 2020, and ending around -42%pt in 2024. Other industries show more moderate declines, with Manufacturing (orange) and Service (green) ending around -20%pt and -25%pt respectively. Wholesale (red) and Small Retail (purple) remain relatively stable, ending around -15%pt and -10%pt.
| 業種 | 94Q1 | 96Q1 | 98Q1 | 00Q1 | 02Q1 | 04Q1 | 06Q1 | 08Q1 | 10Q1 | 12Q1 | 14Q1 | 16Q1 | 18Q1 | 20Q1 | 22Q1 | 24Q1 |
|---|---|---|---|---|---|---|---|---|---|---|---|---|---|---|---|---|
| 建設業 | -20 | -18 | -15 | -10 | -5 | -2 | -1 | 0 | 5 | 0 | -15 | -25 | -35 | -45 | -35 | -42 |
| 製造業 | -5 | -2 | 5 | 10 | 5 | 0 | -2 | 15 | 10 | 5 | -5 | -10 | -15 | -20 | -15 | -20 |
| 卸売業 | 5 | 2 | 0 | 0 | 0 | 0 | 0 | 0 | 0 | 0 | 0 | 0 | 0 | 0 | 0 | 0 |
| 小売業 | -5 | -2 | 0 | 0 | 0 | 0 | 0 | 0 | 0 | 0 | 0 | 0 | 0 | 0 | 0 | 0 |
| サービス業 | -10 | -8 | -5 | -2 | -1 | 0 | 0 | 0 | 0 | 0 | 0 | 0 | 0 | 0 | 0 | 0 |
資料:中小企業庁・(独)中小企業基盤整備機構「中小企業景況調査」
(注)従業員数過不足DIは、従業員数の今期の水準について、「過剰」と答えた企業の割合(%)から、「不足」と答えた企業の割合(%)を引いたもの。