ここからは、設備投資の動向について確認する。
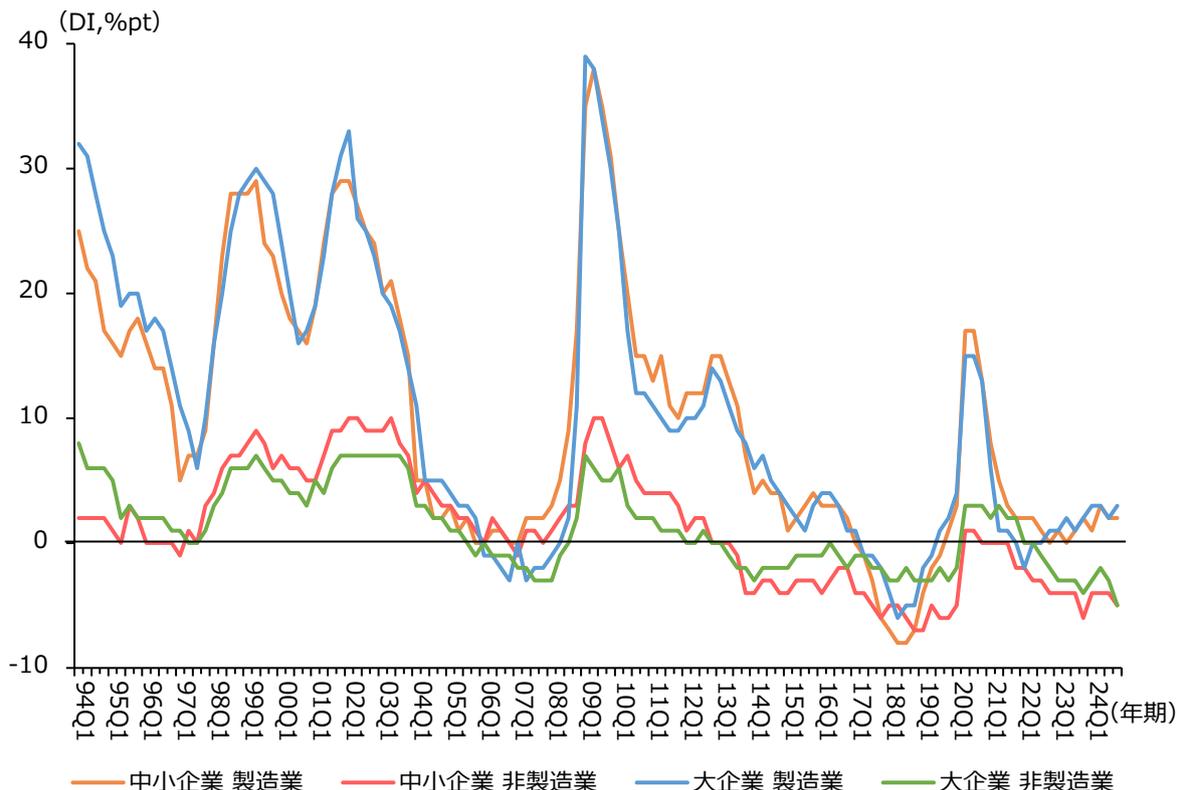
第1-1-34図は、日本銀行「全国企業短期経済観測調査」を用いて、生産・営業用設備判断DIの推移を見たものである。これを見ると、中小企業・大企業共にいずれの業種でも2020年には一
時的に過剰感が強まり、2021年から2022年にかけて過剰感は収束した。2024年においては、製造業では過剰感が強まっている傾向、非製造業では不足感が強まっている傾向にある。
第1-1-34図 生産・営業用設備判断DIの推移(企業規模別、業種別)
Line graph showing the trend of the Production and Business Equipment Judgment DI (DI, %pt) from 1994 to 2024 for four categories: Small Business Manufacturing (orange), Small Business Non-Manufacturing (red), Large Business Manufacturing (blue), and Large Business Non-Manufacturing (green). The Y-axis ranges from -10 to 40. The X-axis shows quarterly periods from 94Q1 to 24Q1. The graph shows significant fluctuations, with a major peak for all categories around 2009Q1, followed by a sharp decline. Manufacturing DI's generally remain higher than Non-Manufacturing DI's, especially in the later years.
資料:日本銀行「全国企業短期経済観測調査」
(注)1.ここでの大企業は資本金10億円以上、中小企業は資本金2千万円以上1億円未満の企業とする。なお、2003年第4四半期以前の調査においては、大企業は常用雇用者数1,000人以上、中小企業は常用雇用者数50~299人の企業とする。
2.「生産・営業用設備判断DI」は、生産・営業用設備について、「過剰」と答えた企業の割合(%)から、「不足」と答えた企業の割合(%)を引いたもの。