上記の手法により推計された価格転嫁力指標を企業規模別・業種別に見ると、「製造業」、「非製造業」共に、「中小企業」の価格転嫁力指標が「大企業」と比べて低い水準で推移していることが分かる。「製造業」では「大企業」が前期比プラスで推移しているのに対して、「中小企業」は前期比マイナスからゼロ近傍で推移しており、価格転嫁が十分に進んでいないことが推察される。一方で、「非製造業」では、足下の価格転嫁力指標が「大企業」、「中小企業」共に前期比プラスとなっており、価格転嫁が比較的順調に進んでいることが示唆される(コラム1-1-7①図)。

コラム 1-1-7①図 価格転嫁力指標の推移(企業規模別、業種別)

Two line charts showing the trend of the price pass-through index for Manufacturing and Non-Manufacturing sectors from 2015Q1 to 2024Q1. The left chart for Manufacturing shows the index for large enterprises (blue line) fluctuating around 0% to 1%, while small enterprises (orange line) fluctuate around -1% to 0%. The right chart for Non-Manufacturing shows both large and small enterprises trending upwards from 2022 onwards, with large enterprises reaching above 2% and small enterprises reaching around 1.5% by 2024Q1. A shaded area at the bottom of each chart represents the scale gap (small - large) on the right axis, ranging from -3 to 3 percentage points.

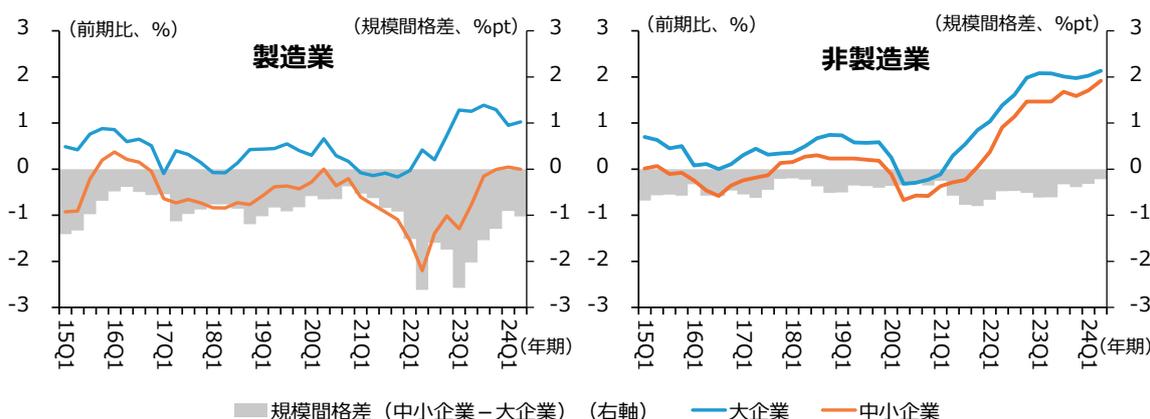
資料:日本銀行「全国企業短期経済観測調査」「企業物価指数」「企業向けサービス価格指数」「最終需要・中間需要物価指数」、総務省「消費者物価指数」「産業連関表」

(注) 1. ここでの大企業は資本金10億円以上、中小企業は資本金2千万円以上1億円未満の企業をいう。

2. ここで「価格転嫁力指標」とは、仕入価格の変化分を販売価格にどの程度転嫁できているか(すなわち、価格転嫁力)について、前期比変化率を数値化したものを指す。算出方法の詳細は、鎌田・吉村(2010)、2014年版中小企業白書付注1-1-1を参照。

続いて、価格転嫁力指標と労働生産性との関係性を見ていく。コラム1-1-7②図は、財務省「法人企業統計調査」を用いて算出した「一人当たり名目付加価値額」の変化率から、価格転嫁力指標の変化率を差し引いた残差を「実質労働生産性」の変化率として表示し、「一人当たり名目付加価値額」の変動要因を算出したものである。

これを見ると、製造業においては、中小企業では大企業と比較して、「価格転嫁力指標」が低く、「一人当たり名目付加価値額」の上昇率の押し下げに寄与していることが分かる。足下の動きとしては、2022年のロシアによるウクライナ侵攻に伴う輸入物価上昇の影響等により「中小企業・製造業」の「価格転嫁力指標」は落ち込んだものの、2023年度には価格転嫁への取組もあり回復傾向に転じたのではないかと考えられる。

一方、非製造業においては、2022年度以降、中小企業・大企業共に「価格転嫁力指標」が上昇していることが分かる。足下の動きとしては、2022年以降の原材料費をはじめとする諸物価の高騰を背景に、消費者・販売先への価格転嫁が進み、「一人当たり名目付加価値額」の上昇率の押し上げに寄与していることが示唆される 61

61 非製造業には、仕入価格の変動が直接的に販売価格に反映されやすい小売業や卸売業も含まれており、これらの業種では価格転嫁力指標が高く出やすい構造にあるが、仕入価格の上昇分を転嫁できても収益向上に直結しているとは限らない可能性があることに留意が必要。