第1-1-57図は、中小企業・小規模事業者における賃上げの実施状況を見たものである。これを見ると、賃上げを実施する中小企業・小規模事業者の割合は高まっているが、中でも業績の改善を
きっかけとしない賃上げの割合が高まっており、賃上げを実施した企業のうちの過半数を占めていることが分かる。
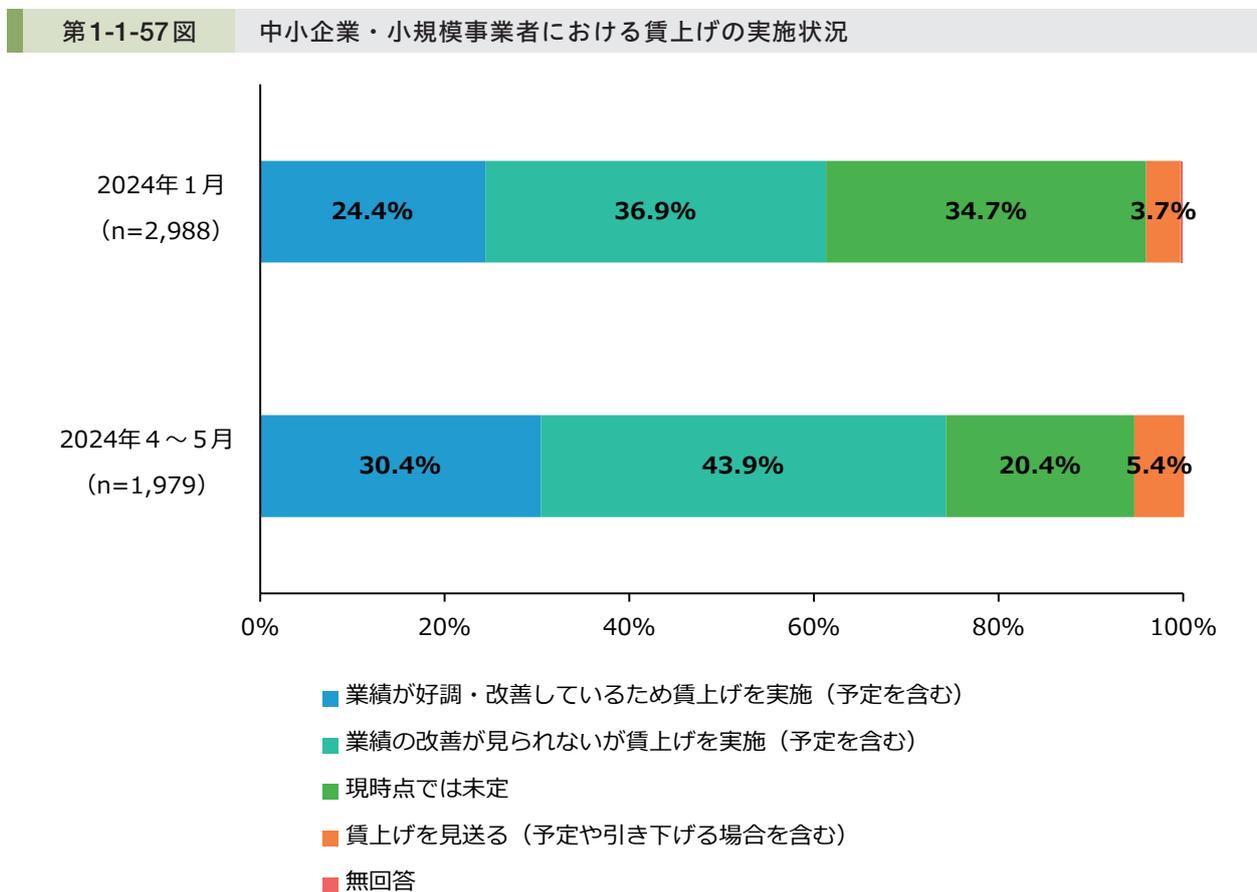
第1-1-57図 中小企業・小規模事業者における賃上げの実施状況
| 調査期間 | 業績が好調・改善しているため賃上げを実施(予定を含む) | 業績の改善が見られないが賃上げを実施(予定を含む) | 現時点では未定 | 賃上げを見送る(予定や引き下げる場合を含む) | 無回答 |
|---|---|---|---|---|---|
|
2024年1月
(n=2,988) |
24.4% | 36.9% | 34.7% | 3.7% | 0.3% |
|
2024年4~5月
(n=1,979) |
30.4% | 43.9% | 20.4% | 5.4% | 0.4% |
Stacked bar chart showing wage increase implementation status for SMEs. The chart compares two periods: January 2024 (n=2,988) and April-May 2024 (n=1,979). The categories are: 'Wage increase implemented due to improved performance' (blue), 'Wage increase implemented despite no visible performance improvement' (teal), 'Undecided' (green), 'No wage increase' (orange), and 'No answer' (red).
資料:日本商工会議所・東京商工会議所「『中小企業の賃金改定に関する調査』集計結果」(2024年6月5日)、「『中小企業の人手不足、賃金・最低賃金に関する調査』集計結果」(2024年2月14日)