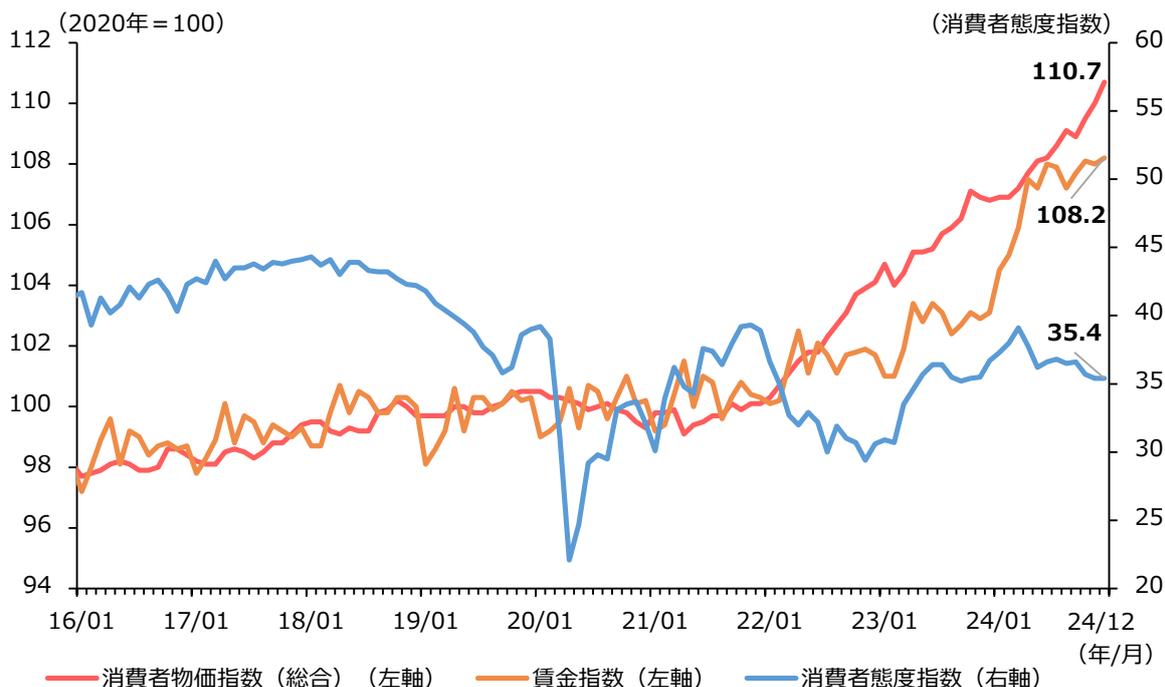
第1-1-58図は、消費者物価指数・賃金指数・消費者態度指数の推移を見たものである。これを見ると、ここまで確認したような賃上げの動向を背景に、「賃金指数」は直近数年間で上昇傾向にあり、令和6年平均の所定内給与は対前年比で
2.1%と30年ぶりの高い伸びとなった 70 。一方で「消費者物価指数」は「賃金指数」を上回る上昇を続けており、こうした動向などを受けて、「消費者態度指数」が低下している可能性が考えられる。
第1-1-58図 消費者物価指数・賃金指数・消費者態度指数の推移
| 年/月 | 消費者物価指数 (総合) (左軸) | 賃金指数 (左軸) | 消費者態度指数 (右軸) |
|---|---|---|---|
| 16/01 | 97.5 | 97.5 | 40.0 |
| 17/01 | 98.5 | 98.5 | 41.0 |
| 18/01 | 99.5 | 99.5 | 42.0 |
| 19/01 | 100.0 | 100.0 | 40.0 |
| 20/01 | 100.0 | 100.0 | 35.0 |
| 21/01 | 100.0 | 100.0 | 38.0 |
| 22/01 | 101.0 | 101.0 | 38.0 |
| 23/01 | 104.0 | 102.0 | 35.0 |
| 24/01 | 108.0 | 105.0 | 38.0 |
| 24/12 | 110.7 | 108.2 | 35.4 |
Line graph showing the trend of Consumer Price Index, Wage Index, and Consumer Attitude Index from 2016 to 2024. The graph has two y-axes: the left axis for the Consumer Price Index and Wage Index (2020=100) and the right axis for the Consumer Attitude Index. The x-axis shows dates from 16/01 to 24/12. The Consumer Price Index (red line) and Wage Index (orange line) both show an upward trend, with the Consumer Price Index reaching 110.7 and the Wage Index reaching 108.2 by 2024/12. The Consumer Attitude Index (blue line) shows a downward trend, ending at 35.4 in 2024/12.
資料:総務省「消費者物価指数」、厚生労働省「毎月勤労統計調査」、内閣府「消費動向調査」
(注) 1. 「消費者物価指数 (総合)」、「賃金指数」はいずれも2020年を基準としている。
2. 「賃金指数」は、事業所規模5人以上の、所定内給与の賃金指数を用いている。
3. 「消費者態度指数」は、原数値(総世帯)を用いている。
事例1-1-7では、省力化投資や適切な価格転嫁の事例を紹介する。により収益力を高め、賃上げを実現している企業
70 厚生労働省「毎月勤労統計調査 令和6年分結果速報 プレスリリース」より引用。なお、令和7年2月25日に確報値が公表されたが、令和6年平均の所定内給与の前年比は、速報値と同一であった。