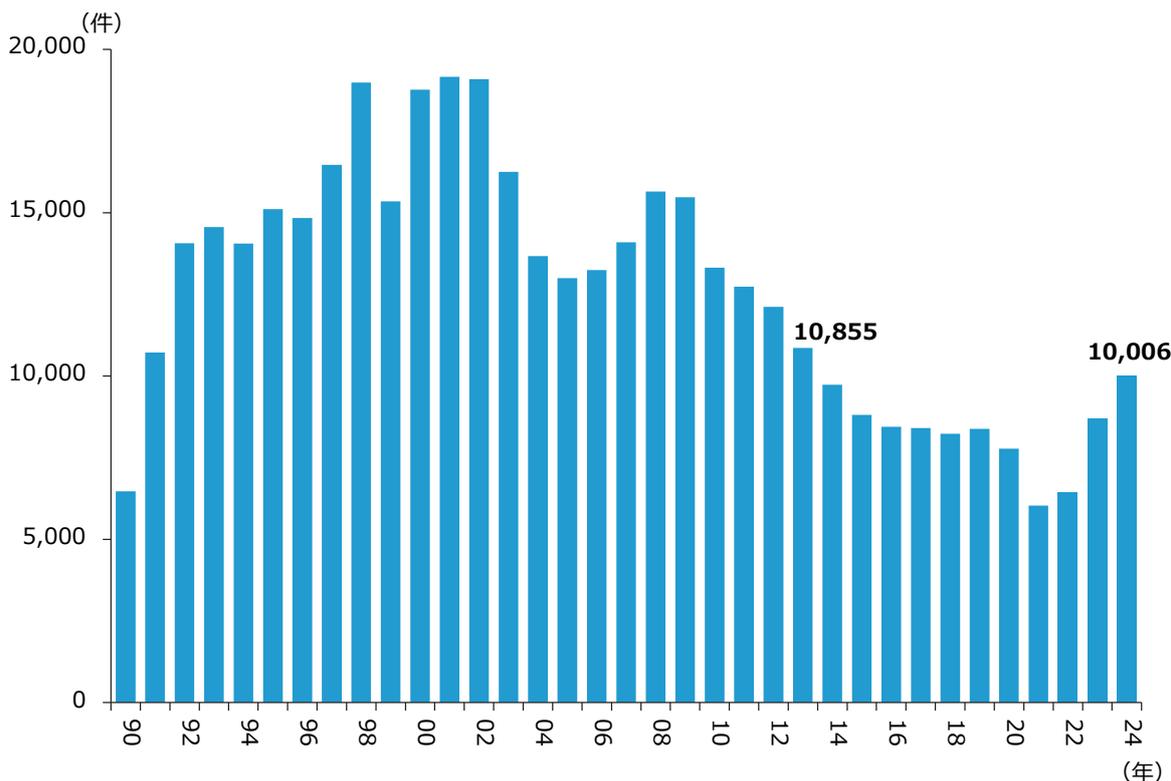
第1-1-60図は、倒産件数の推移を見たものである。2009年以降、倒産件数は減少傾向だったが、2021年を底に増加傾向に転じ、2024年の倒産件数は10,006件だった。
また、従業員規模別に見ると、「~4人」の企
業が大半を占めている。要因別に見ると、「人手不足」に関連するものに加え、「物価高」を要因とした倒産の件数も増加していることが分かる 71 (第1-1-61図)。
第1-1-60図 倒産件数の推移
| 年 | 倒産件数 |
|---|---|
| 00 | 6,444 |
| 01 | 10,644 |
| 02 | 14,044 |
| 03 | 14,544 |
| 04 | 14,044 |
| 05 | 15,044 |
| 06 | 14,844 |
| 07 | 16,444 |
| 08 | 18,844 |
| 09 | 15,344 |
| 10 | 18,544 |
| 11 | 18,855 |
| 12 | 16,244 |
| 13 | 13,544 |
| 14 | 12,544 |
| 15 | 10,855 |
| 16 | 9,544 |
| 17 | 8,444 |
| 18 | 8,111 |
| 19 | 8,344 |
| 20 | 7,744 |
| 21 | 5,944 |
| 22 | 6,344 |
| 23 | 8,644 |
| 24 | 10,006 |
Bar chart showing the number of bankruptcies from 2000 to 2024. The y-axis represents the number of bankruptcies (0 to 20,000) and the x-axis represents the year (2000 to 2024). The chart shows a peak in 2011 with 18,855 bankruptcies, followed by a decline until 2021 (8,111 bankruptcies), and then an increase to 10,006 bankruptcies in 2024.
資料:(株)東京商工リサーチ「全国企業倒産状況」
(注)1.ここで「倒産」とは、企業が債務の支払不能に陥ることや、経済活動を続けることが困難になった状態となること。また、私的倒産(銀行取引停止処分、内整理)も倒産に含まれる。
2.負債総額1,000万円以上の倒産が集計対象。
71 総務省「労働力調査(基本集計)」によれば、倒産件数が前年比で増加した2022年、2023年及び2024年の完全失業率(年平均)はそれぞれ2.6%、2.6%、2.5%であり、2021年の2.8%と比較して横ばいである。