第1-1-61図 倒産件数の推移(内訳)
(1)倒産件数の推移(従業員規模別)
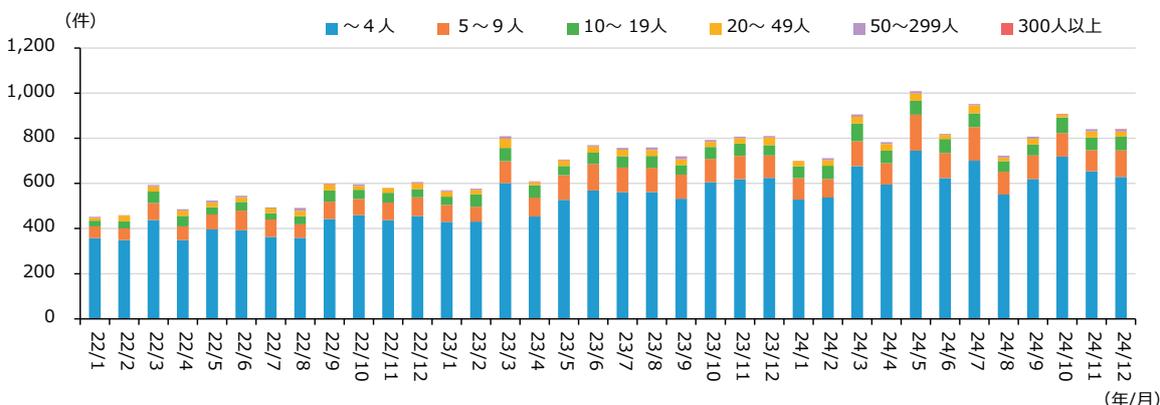
This stacked bar chart displays the number of bankruptcies per month from February 2022 to December 2024, categorized by employee size. The y-axis represents the number of cases (0 to 1,200), and the x-axis shows the months. The legend indicates six employee size categories: ~4 (blue), 5-9 (orange), 10-19 (green), 20-49 (yellow), 50-299 (purple), and 300+ (red). The total number of bankruptcies shows a general upward trend, peaking in mid-2023 at nearly 1,000 cases per month, before slightly declining towards the end of 2024.
(2)「人手不足」関連倒産
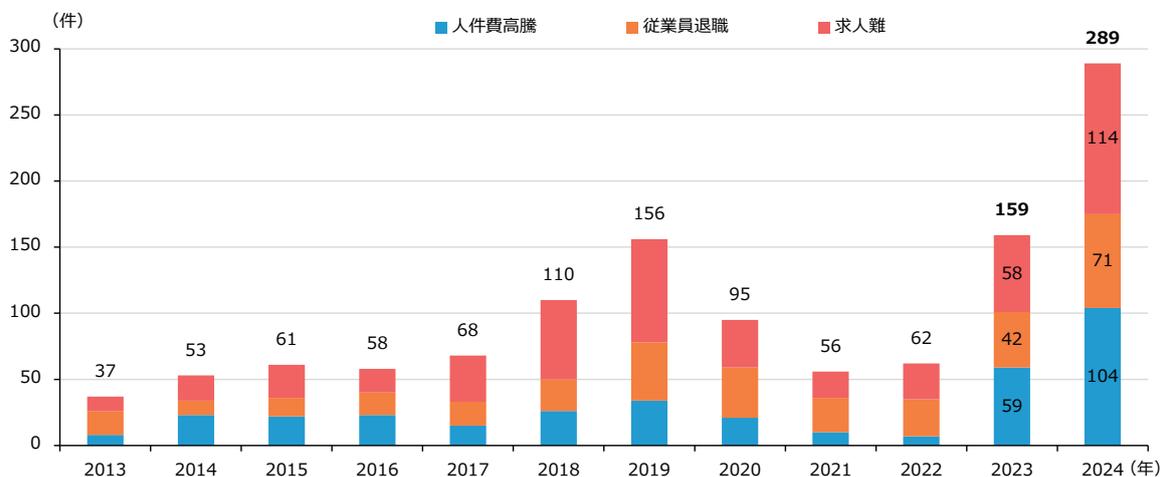
This stacked bar chart shows the number of bankruptcies related to labor shortages from 2013 to 2024. The y-axis represents the number of cases (0 to 300), and the x-axis shows the years. The legend indicates three categories: high labor costs (blue), employee resignations (orange), and recruitment difficulties (red). The total number of cases shows a significant increase over the period, with a notable peak in 2024 (289 cases). The 'recruitment difficulties' category has become the most prominent factor in recent years.
(3)「物価高」倒産
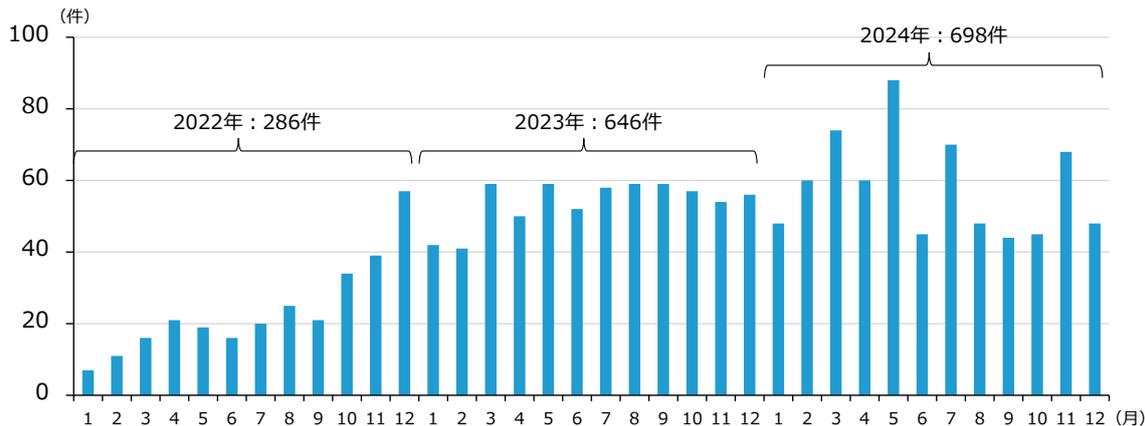
This bar chart displays the number of bankruptcies related to high prices by month for the years 2022, 2023, and 2024. The y-axis represents the number of cases (0 to 100), and the x-axis shows the months (1-12). The total annual counts are 286 for 2022, 646 for 2023, and 698 for 2024. The chart shows a clear upward trend in the frequency and volume of these bankruptcies over the three-year period, with a significant peak in May 2024.
資料:(株)東京商工リサーチ「全国企業倒産状況」
(注)1.ここで「倒産」とは、企業が債務の支払不能に陥ることや、経済活動を続けることが困難になった状態となること。また、私的倒産(銀行取引停止処分、内整理)も倒産に含まれる。
2.負債総額1,000万円以上の倒産が集計対象。
3.ここで「物価高」倒産とは、①仕入コストや資源・原材料価格の上昇、②価格上昇分を価格転嫁できなかった、等による倒産を指す。