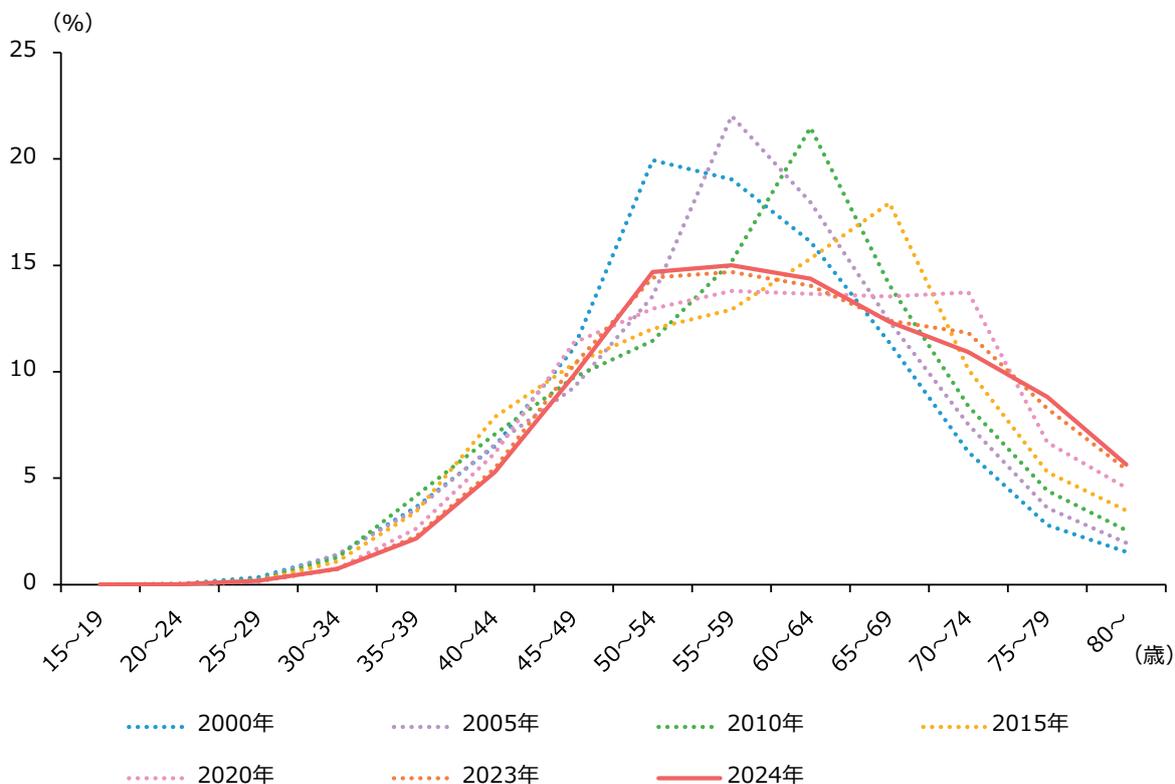
第1-1-68図は、中小企業における経営者年齢の分布を見たものである。これを見ると、中小企
業の経営者年齢の水準は依然として高く、60歳以上の経営者が過半数を占めている。
第1-1-68図 中小企業における経営者年齢の分布
| 年齢区分 (歳) | 2000年 (%) | 2005年 (%) | 2010年 (%) | 2015年 (%) | 2020年 (%) | 2023年 (%) | 2024年 (%) |
|---|---|---|---|---|---|---|---|
| 15~19 | 0.0 | 0.0 | 0.0 | 0.0 | 0.0 | 0.0 | 0.0 |
| 20~24 | 0.1 | 0.1 | 0.1 | 0.1 | 0.1 | 0.1 | 0.1 |
| 25~29 | 0.5 | 0.5 | 0.5 | 0.5 | 0.5 | 0.5 | 0.5 |
| 30~34 | 1.5 | 1.5 | 1.5 | 1.5 | 1.5 | 1.5 | 1.5 |
| 35~39 | 3.5 | 3.5 | 3.5 | 3.5 | 3.5 | 3.5 | 3.5 |
| 40~44 | 7.0 | 7.0 | 7.0 | 7.0 | 7.0 | 7.0 | 7.0 |
| 45~49 | 11.0 | 11.0 | 11.0 | 11.0 | 11.0 | 11.0 | 11.0 |
| 50~54 | 15.0 | 15.0 | 15.0 | 15.0 | 15.0 | 15.0 | 15.0 |
| 55~59 | 19.0 | 20.0 | 19.0 | 19.0 | 19.0 | 19.0 | 22.0 |
| 60~64 | 16.0 | 17.0 | 21.0 | 17.0 | 17.0 | 17.0 | 15.0 |
| 65~69 | 12.0 | 13.0 | 14.0 | 18.0 | 14.0 | 14.0 | 13.0 |
| 70~74 | 8.0 | 9.0 | 10.0 | 12.0 | 14.0 | 12.0 | 11.0 |
| 75~79 | 4.0 | 5.0 | 6.0 | 8.0 | 10.0 | 8.0 | 8.0 |
| 80~ | 1.0 | 1.0 | 2.0 | 3.0 | 5.0 | 4.0 | 5.0 |
Line graph showing the distribution of business owner ages in SMEs from 2000 to 2024. The x-axis shows age groups from 15-19 to 80+ years, and the y-axis shows percentages from 0 to 25%. The graph shows a shift towards older age groups over time, with the 2024 peak at 55-59 years.
資料:(株)帝国データバンク「企業概要ファイル」再編加工
(注)1.ここでの「中小企業」とは、中小企業基本法に定める「中小企業者」のことを指す。なお、企業規模は企業概要ファイルの情報に基づき分類している。
2.経営者年齢の分布は、経営者年齢が判明した中小企業を対象に集計している。
3.データ制約上、「2000年」については、2001年1月更新時点の企業概要ファイルを使用し、ほかの系列については毎年12月更新時点の企業概要ファイルを使用している。
第1節
第2節
第3節
第4節
第5節
第6節
第7節
第8節
第9節