第9節 事業承継
本節では、中小企業・小規模事業者における事業承継の動向について確認する。
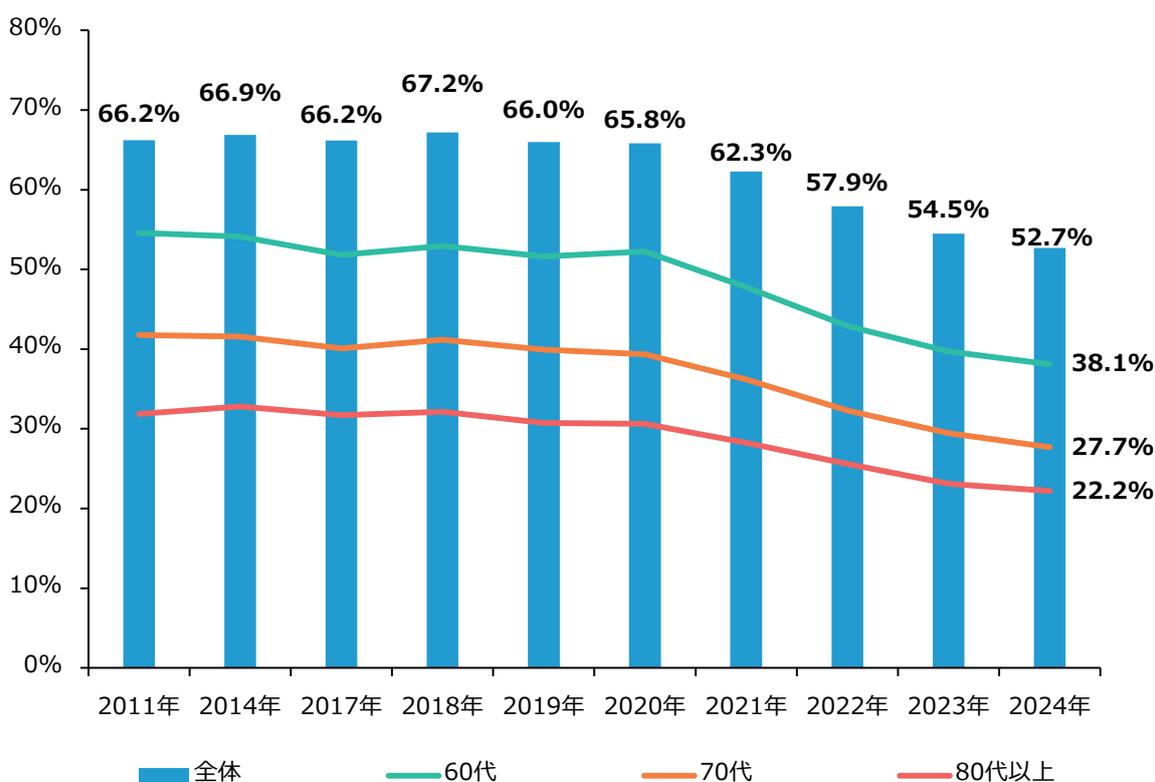
第1-1-67図は、中小企業における後継者不在率の推移を、経営者の年代別に見たものである。これを見ると、「全体」として後継者不在率は減少傾向にあり、経営者の年代が「60代」以上の事業者においても同様に減少傾向にあることから、後継者不足の解消が一定程度進んでいるといえる。
第1-1-67図 中小企業における後継者不在率の推移(経営者の年代別)
| 年 | 全体 (%) | 60代 (%) | 70代 (%) | 80代以上 (%) |
|---|---|---|---|---|
| 2011年 | 66.2% | 54.5% | 41.5% | 31.5% |
| 2014年 | 66.9% | 54.0% | 41.0% | 32.5% |
| 2017年 | 66.2% | 52.0% | 40.0% | 31.5% |
| 2018年 | 67.2% | 53.0% | 41.0% | 32.0% |
| 2019年 | 66.0% | 52.0% | 40.0% | 30.5% |
| 2020年 | 65.8% | 52.0% | 39.5% | 30.5% |
| 2021年 | 62.3% | 48.0% | 36.0% | 28.5% |
| 2022年 | 57.9% | 43.0% | 32.0% | 26.0% |
| 2023年 | 54.5% | 40.0% | 29.0% | 23.5% |
| 2024年 | 52.7% | 38.1% | 27.7% | 22.2% |
A combination bar and line chart showing the succession rate of SMEs by management age group from 2011 to 2024. The x-axis shows years, and the y-axis shows percentages from 0% to 80%. Blue bars represent the overall average, while lines represent age groups: 60s (green), 70s (orange), and 80+ (red). The overall average starts at 66.2% in 2011 and decreases to 52.7% in 2024. The 60s age group starts at 54.5% and decreases to 38.1%. The 70s age group starts at 41.5% and decreases to 27.7%. The 80+ age group starts at 31.5% and decreases to 22.2%.
資料:(株)帝国データバンク「企業概要ファイル」、「信用調査報告書」再編加工
(注)1. ここでの「中小企業」とは、中小企業基本法に定める「中小企業者」のことを指す。なお、企業規模は企業概要ファイルの情報に基づき分類している。
2. 「全体」については、経営者年齢の情報がない企業も含んだ中小企業数に対する割合を示している。