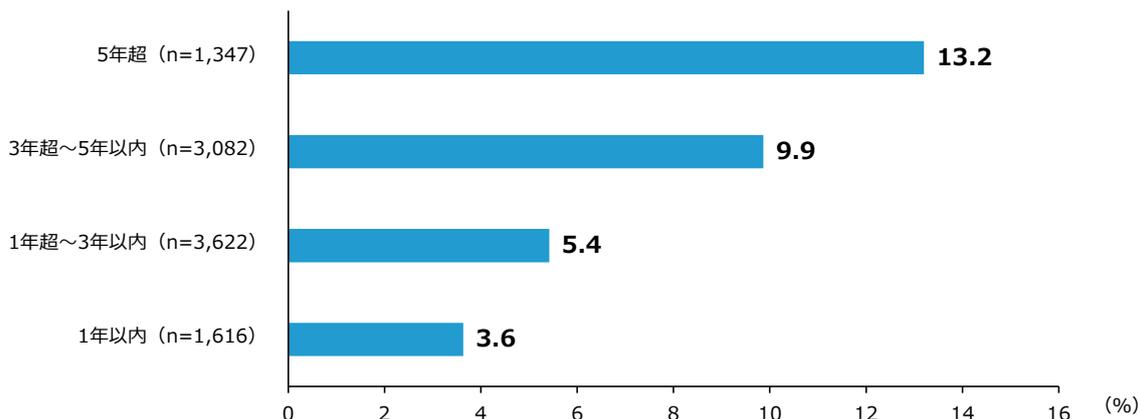
第2-1-16図は、策定している経営計画の計画期間別に、売上高の変化率(中央値)と付加価値額の変化率(中央値)を見たものである。これを見ると、長期を見据えた計画を策定している事業
者ほど、両指標とも高い水準であることが分かる。この調査結果から一概にはいえないが、長期目線での経営計画は、業績の向上をもたらしている可能性がある。
第2-1-16図 売上高、付加価値額の変化率(経営計画の計画期間別、中央値)
(1)売上高の変化率(中央値)
| 計画期間 | 中央値 (%) |
|---|---|
| 5年超 (n=1,347) | 13.2 |
| 3年超~5年以内 (n=3,082) | 9.9 |
| 1年超~3年以内 (n=3,622) | 5.4 |
| 1年以内 (n=1,616) | 3.6 |
Horizontal bar chart showing the central value of sales growth rate by planning period. The y-axis lists planning periods: 5 years or more (n=1,347), 3 to 5 years (n=3,082), 1 to 3 years (n=3,622), and 1 year or less (n=1,616). The x-axis shows the growth rate in percentage from 0 to 16. The bars show 13.2%, 9.9%, 5.4%, and 3.6% respectively.
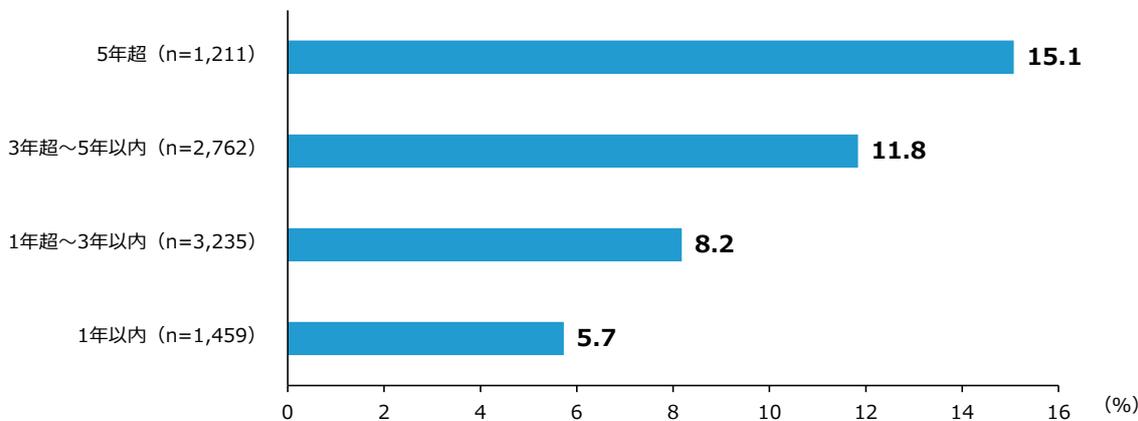
(2)付加価値額の変化率(中央値)
| 計画期間 | 中央値 (%) |
|---|---|
| 5年超 (n=1,211) | 15.1 |
| 3年超~5年以内 (n=2,762) | 11.8 |
| 1年超~3年以内 (n=3,235) | 8.2 |
| 1年以内 (n=1,459) | 5.7 |
Horizontal bar chart showing the central value of value-added growth rate by planning period. The y-axis lists planning periods: 5 years or more (n=1,211), 3 to 5 years (n=2,762), 1 to 3 years (n=3,235), and 1 year or less (n=1,459). The x-axis shows the growth rate in percentage from 0 to 16. The bars show 15.1%, 11.8%, 8.2%, and 5.7% respectively.
資料:(株)帝国データバンク「令和6年度中小企業の経営課題と事業活動に関する調査」
(注)1. 経営計画を「策定している」と回答した事業者に対して、策定している経営計画は最長で何年先を見据えたものか聞いたもの。なお、「5年超」は、「5年超~10年以内」、「10年超」と回答した事業者の合計。
2. 売上高、付加価値額の変化率は、2023年と2018年を比較して算出したもの。
3. 付加価値額 = 営業利益 + 人件費 + 賃借料 + 租税公課。