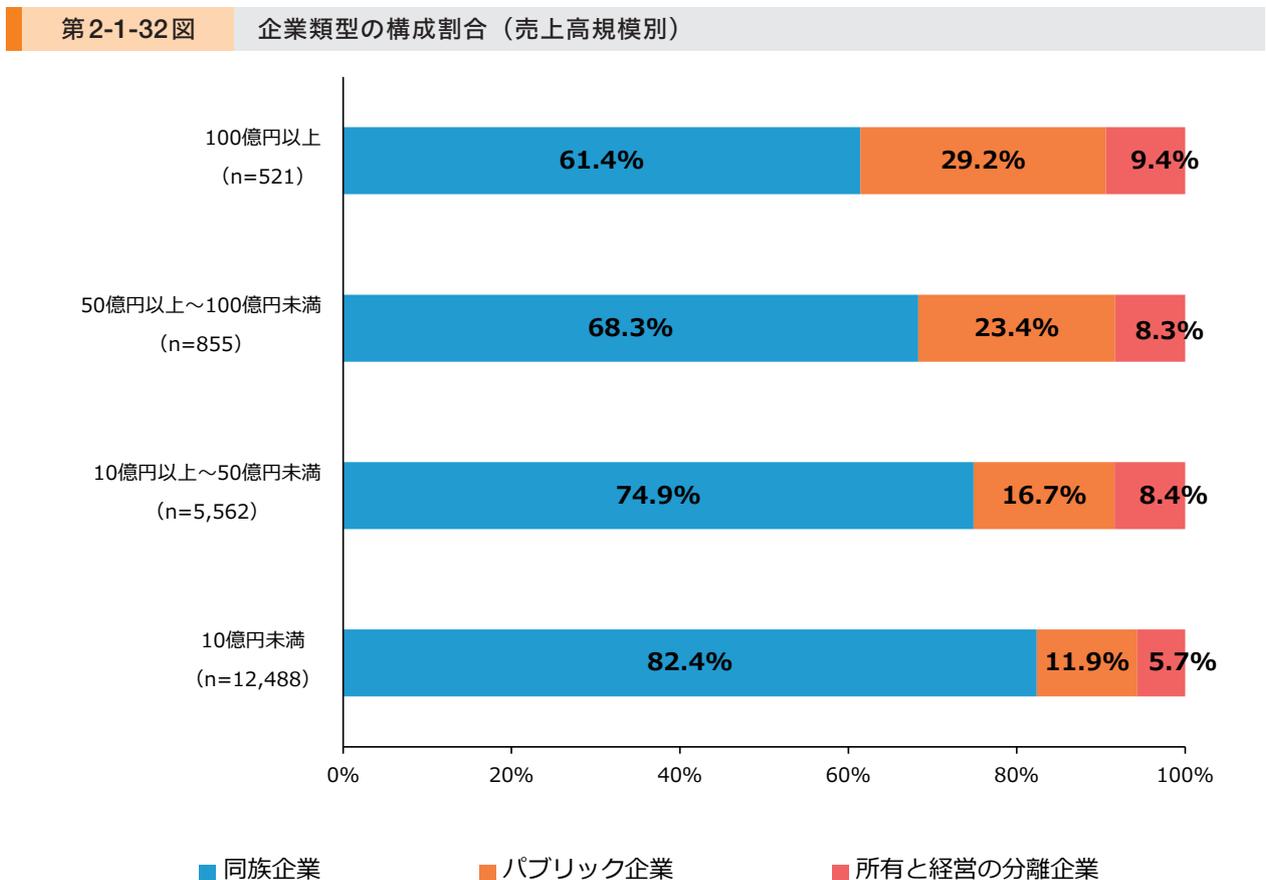
第2-1-32図は、売上高規模別に企業類型の構成割合を見たものである。売上高規模が大きくなるほど「同族企業」の割合が低下し、「パブリック企業」の割合が高まっていることが見て取れる。
第2-1-32図 企業類型の構成割合(売上高規模別)
| 売上高規模 | 同族企業 | パブリック企業 | 所有と経営の分離企業 |
|---|---|---|---|
| 100億円以上 (n=521) | 61.4% | 29.2% | 9.4% |
| 50億円以上~100億円未満 (n=855) | 68.3% | 23.4% | 8.3% |
| 10億円以上~50億円未満 (n=5,562) | 74.9% | 16.7% | 8.4% |
| 10億円未満 (n=12,488) | 82.4% | 11.9% | 5.7% |
Horizontal stacked bar chart showing the composition ratio of company types by sales volume. The chart shows a decrease in family-owned companies and an increase in public companies as sales volume increases.
資料:(株)帝国データバンク「令和6年度中小企業の経営課題と事業活動に関する調査」
- (注)1.組織形態について「法人」と回答した事業者に聞いたもの。
- 2.ここでの売上高は、直近(1期前)の売上高に基づいて集計している。「事業を開始していない」と回答した事業者は除く。