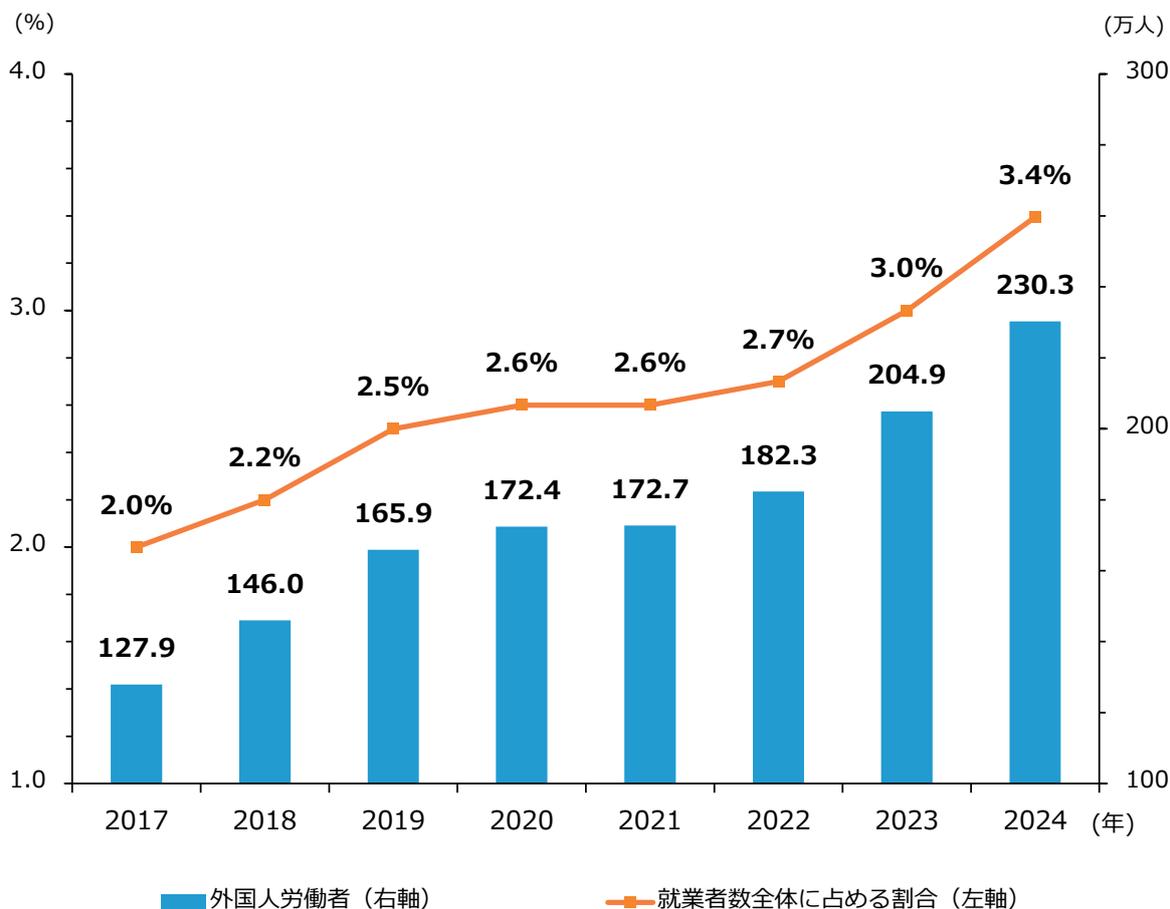
ここでは、外国人労働者について確認する。第2-1-50図は、総務省「労働力調査(基本集計)」、厚生労働省「『外国人雇用状況』の届出状況まとめ」を用いて、外国人労働者数と就業者数全体に
占める割合の推移を見たものである。これを見ると、外国人労働者数・割合共に増加傾向にあることが分かる。外国人労働者の活用拡大は人材不足緩和の一助になる可能性がある。
第2-1-50図 外国人労働者数と就業者数全体に占める割合の推移
| 年 | 外国人労働者数 (万人) | 就業者数全体に占める割合 (%) |
|---|---|---|
| 2017 | 127.9 | 2.0% |
| 2018 | 146.0 | 2.2% |
| 2019 | 165.9 | 2.5% |
| 2020 | 172.4 | 2.6% |
| 2021 | 172.7 | 2.6% |
| 2022 | 182.3 | 2.7% |
| 2023 | 204.9 | 3.0% |
| 2024 | 230.3 | 3.4% |
A combined bar and line chart showing the trend of foreign workers and their share of total employment from 2017 to 2024. The x-axis represents years. The left y-axis shows the percentage share (1.0 to 4.0), and the right y-axis shows the number of foreign workers in ten thousand units (100 to 300). Blue bars represent the number of foreign workers, and an orange line with square markers represents the percentage share.
資料:総務省「労働力調査(基本集計)」、厚生労働省「『外国人雇用状況』の届出状況まとめ」
(注)就業者数は年平均、外国人労働者数は各年10月末時点の数値。