④有形固定資産
次に、有形固定資産の活用状況を確認していく。
第2-2-13図は、スケールの変動状況別に有形固定資産の推移を見たものである。これを見ると、「スケールアップ」、「維持」企業は、10年間
で有形固定資産を増やしてきた一方で、「スケールダウン」企業は、設備投資による資産の取得が進まない中で、既存資産の減価償却や売却・処分などにより有形固定資産を減らしてきたことがうかがえる。
第2-2-13図 有形固定資産の推移(スケール変動状況別)
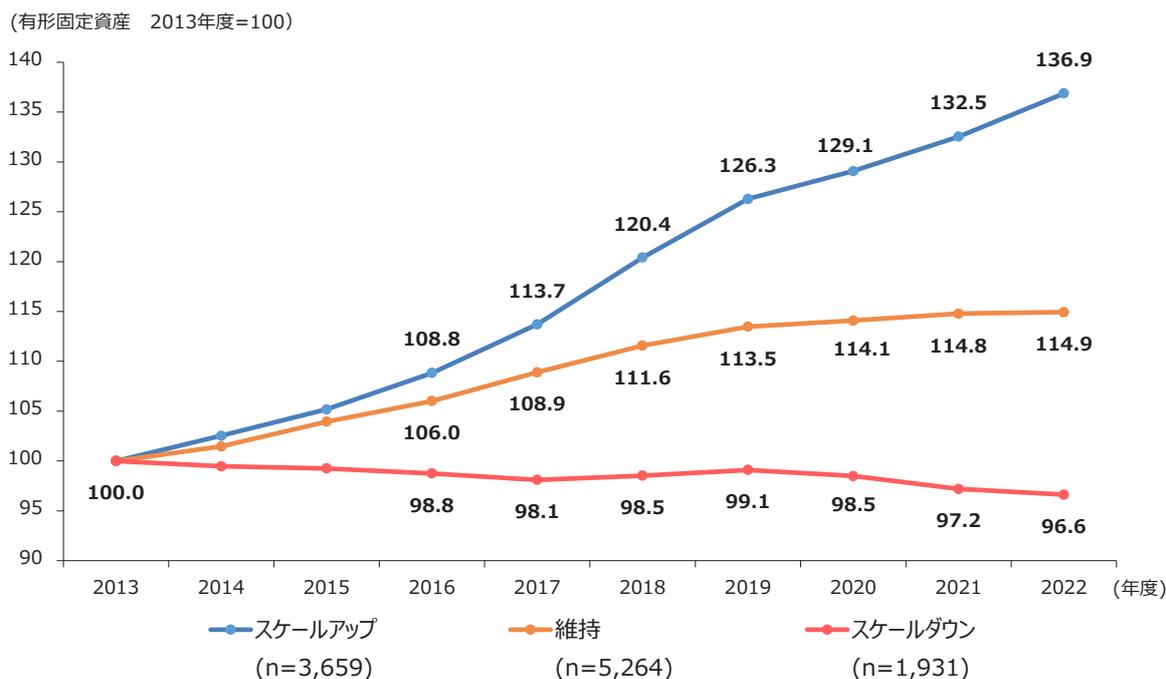
(有形固定資産 2013年度=100)
| 年度 | スケールアップ (n=3,659) | 維持 (n=5,264) | スケールダウン (n=1,931) |
|---|---|---|---|
| 2013 | 100.0 | 100.0 | 100.0 |
| 2014 | 102.5 | 101.5 | 99.5 |
| 2015 | 105.0 | 103.5 | 99.0 |
| 2016 | 108.8 | 106.0 | 98.8 |
| 2017 | 113.7 | 108.9 | 98.1 |
| 2018 | 120.4 | 111.6 | 98.5 |
| 2019 | 126.3 | 113.5 | 99.1 |
| 2020 | 129.1 | 114.1 | 98.5 |
| 2021 | 132.5 | 114.8 | 97.2 |
| 2022 | 136.9 | 114.9 | 96.6 |
Line graph showing the trend of fixed assets from 2013 to 2022 for three groups: Scale Up, Maintain, and Scale Down. The Y-axis represents the index (2013=100) and the X-axis represents the year. Scale Up (blue line) shows a strong upward trend, reaching 136.9 in 2022. Maintain (orange line) shows a steady increase, reaching 114.9 in 2022. Scale Down (red line) shows a slight downward trend, ending at 96.6 in 2022.
資料:経済産業省「企業活動基本調査」再編加工
(注) 1.パネルデータを基に算出している。パネルデータの詳細は、第2部第2章第2節冒頭の脚注を参照。
2.2013年度と比較した、2022年度までの変化を見たもの。