⑦設備投資の実施有無別に見た、売上高の推移
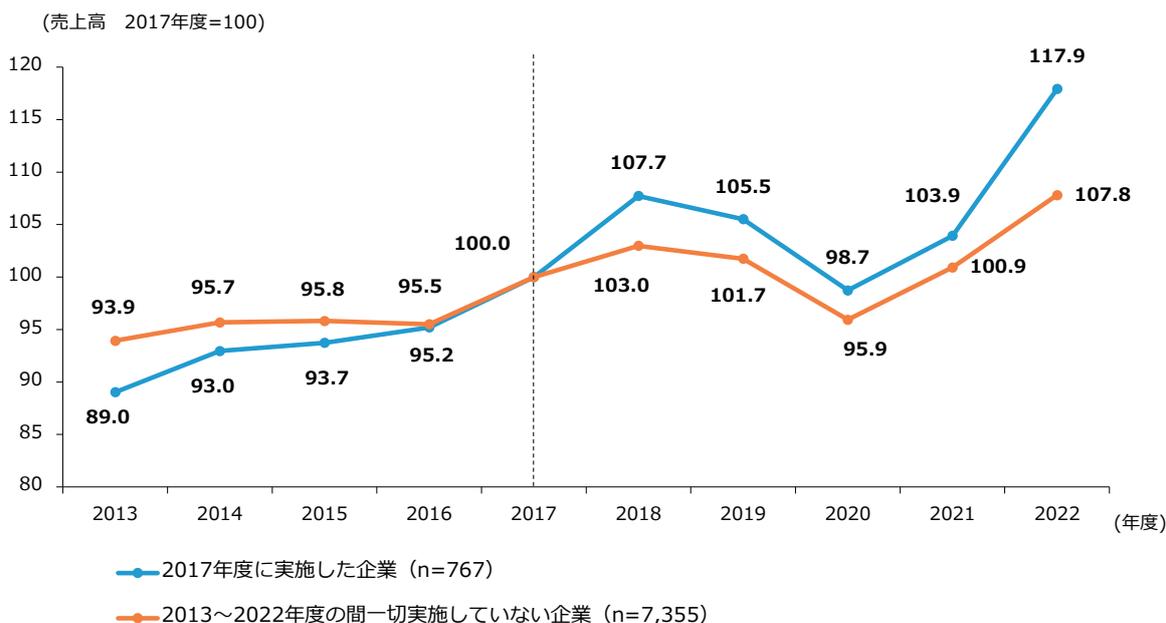
第2-2-16図は、設備投資の実施有無別に、企業の売上高の推移を見たものである。これを見ると、「2017年度に実施した企業」の方が、「2013~2022年度の間に一切実施していない企業」より
も、売上高を向上させていることが分かる。この調査結果から一概にはいえないが、設備投資はスケールアップにおいて有効である可能性が示唆される 28 。
第2-2-16図 売上高の推移(設備投資の実施有無別)
| 年度 | 2017年度に実施した企業 (n=767) | 2013~2022年度の間に一切実施していない企業 (n=7,355) |
|---|---|---|
| 2013 | 89.0 | 93.9 |
| 2014 | 93.0 | 95.7 |
| 2015 | 93.7 | 95.8 |
| 2016 | 95.2 | 95.5 |
| 2017 | 100.0 | 100.0 |
| 2018 | 107.7 | 103.0 |
| 2019 | 105.5 | 101.7 |
| 2020 | 98.7 | 95.9 |
| 2021 | 103.9 | 100.9 |
| 2022 | 117.9 | 107.8 |
Line chart showing sales index (2017=100) from 2013 to 2022 for two groups: companies that implemented equipment investment in 2017 (blue line) and those that did not (orange line).
資料:経済産業省「企業活動基本調査」再編加工
- (注)1.パネルデータを基に算出している。パネルデータの詳細は、第2部第2章第2節冒頭の脚注を参照。
- 2.ここでいう「設備投資の実施」とは、「有形固定資産当期取得額」が同期の売上高の10%より大きい場合をいう。
- 3.2017年度の数値を100として、2013年度から2022年度までの変化を見たもの。
28 設備投資については、第2章第3節第1項で詳細に分析している。