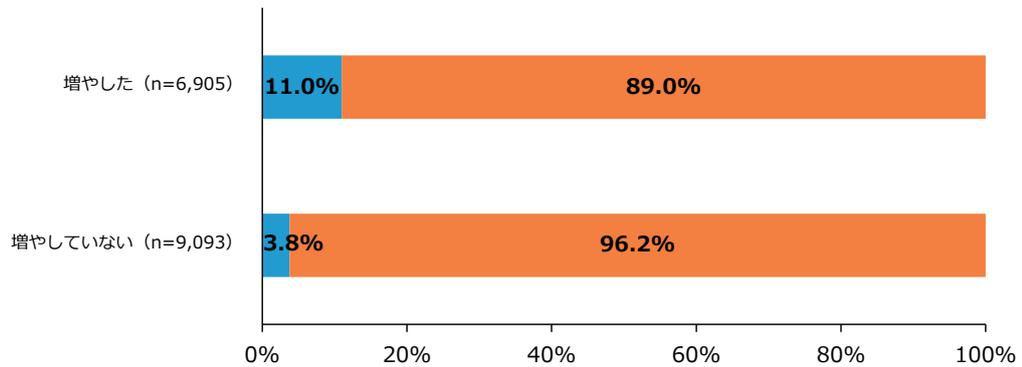
第2-2-21図 スケール変動状況(人材育成の取組の増減別、スケール別)
(1) 売上高10億円未満(5期前)
| Category | Scale-up (%) | Horizontal or Scale-down (%) |
|---|---|---|
| 増やした (n=6,905) | 11.0% | 89.0% |
| 増やしていない (n=9,093) | 3.8% | 96.2% |
Stacked bar chart showing scale change status for companies with sales under 100 million yen 5 periods ago. The chart compares 'Increased' (n=6,905) and 'Not Increased' (n=9,093) groups. For the 'Increased' group, 11.0% experienced scale-up and 89.0% experienced horizontal or scale-down. For the 'Not Increased' group, 3.8% experienced scale-up and 96.2% experienced horizontal or scale-down.
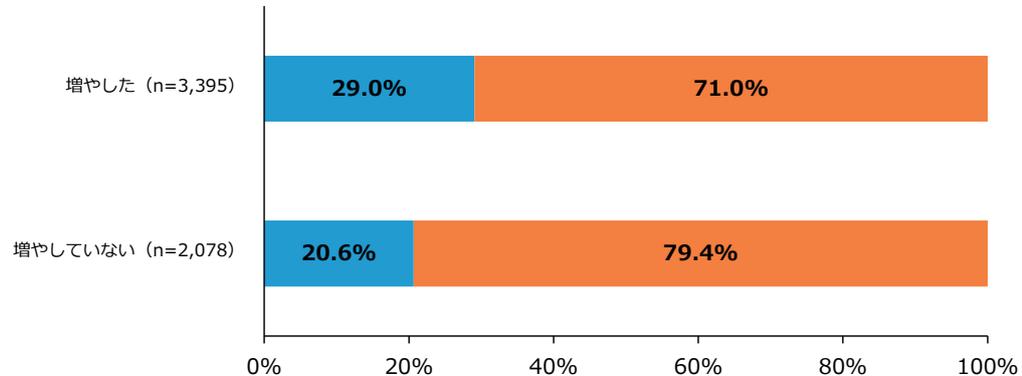
(2) 売上高10億円以上~50億円未満(5期前)
| Category | Scale-up (%) | Horizontal or Scale-down (%) |
|---|---|---|
| 増やした (n=3,395) | 29.0% | 71.0% |
| 増やしていない (n=2,078) | 20.6% | 79.4% |
Stacked bar chart showing scale change status for companies with sales between 100 million and 500 million yen 5 periods ago. The chart compares 'Increased' (n=3,395) and 'Not Increased' (n=2,078) groups. For the 'Increased' group, 29.0% experienced scale-up and 71.0% experienced horizontal or scale-down. For the 'Not Increased' group, 20.6% experienced scale-up and 79.4% experienced horizontal or scale-down.
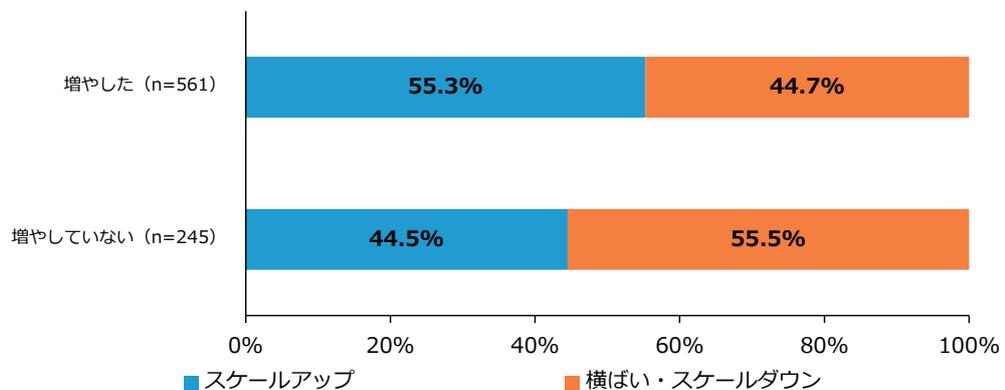
(3) 売上高50億円以上~100億円未満(5期前)
| Category | Scale-up (%) | Horizontal or Scale-down (%) |
|---|---|---|
| 増やした (n=561) | 55.3% | 44.7% |
| 増やしていない (n=245) | 44.5% | 55.5% |
Stacked bar chart showing scale change status for companies with sales between 500 million and 1 billion yen 5 periods ago. The chart compares 'Increased' (n=561) and 'Not Increased' (n=245) groups. For the 'Increased' group, 55.3% experienced scale-up and 44.7% experienced horizontal or scale-down. For the 'Not Increased' group, 44.5% experienced scale-up and 55.5% experienced horizontal or scale-down.
資料:(株)帝国データバンク「令和6年度中小企業の経営課題と事業活動に関する調査」
(注)1.「人材育成の取組の増減」は、5年前(2019年)と比べた、人材育成の取組状況を聞いたもの。「増やした」は、「大いに増やした」、「やや増やした」の合計。「増やしていない」は、「変わらない」、「やや減らした」、「大いに減らした」の合計。「従業員はいない」、「業歴5年未満」と回答した事業者は集計から除いている。
2.5期前と今期見通しの売上高を比較して、第2-2-6図の売上高区分を基に、上方遷移した場合を「スケールアップ」、スケールの変動がない場合又は下方遷移した場合を「横ばい・スケールダウン」と定義している。なお、ここでの5期前は決算期を指しており、5年前(2019年)と同義でないことに留意する。