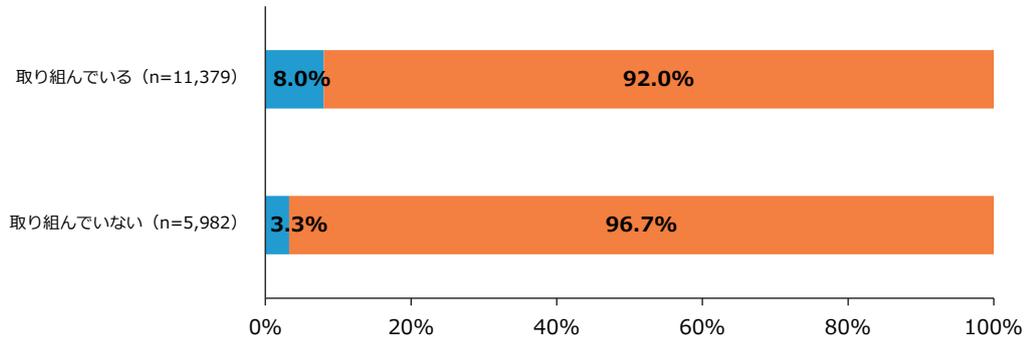
第2-2-26図 スケール変動状況(従業員への経営理念・ビジョンの共有の取組状況別)
(1) 売上高10億円未満(5期前)
| 取組状況 | サンプル数 | スケールアップ | 横ばい・スケールダウン |
|---|---|---|---|
| 取り組んでいる | 11,379 | 8.0% | 92.0% |
| 取り組んでいない | 5,982 | 3.3% | 96.7% |
Stacked bar chart showing scale change status for companies with sales under 100 million yen. 8.0% of those 'taking action' and 3.3% of those 'not taking action' are doing 'Scale Up'.
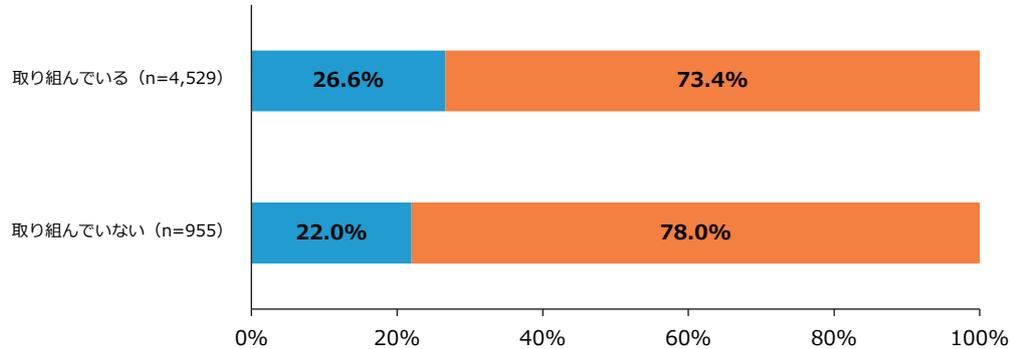
(2) 売上高10億円以上~50億円未満(5期前)
| 取組状況 | サンプル数 | スケールアップ | 横ばい・スケールダウン |
|---|---|---|---|
| 取り組んでいる | 4,529 | 26.6% | 73.4% |
| 取り組んでいない | 955 | 22.0% | 78.0% |
Stacked bar chart showing scale change status for companies with sales between 100 million and 500 million yen. 26.6% of those 'taking action' and 22.0% of those 'not taking action' are doing 'Scale Up'.
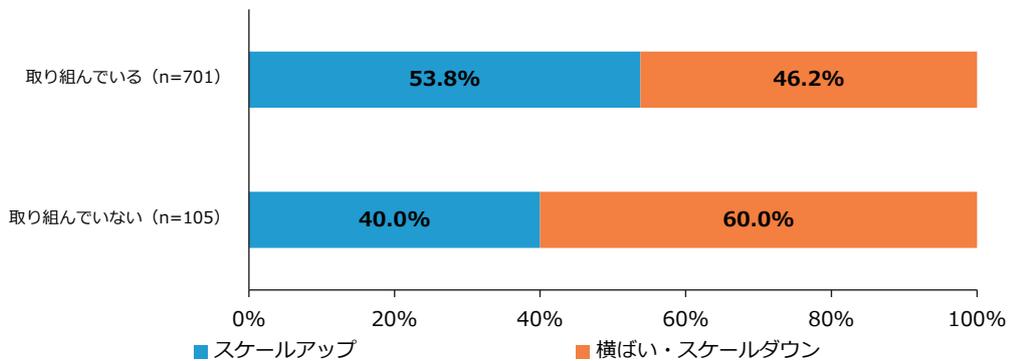
(3) 売上高50億円以上~100億円未満(5期前)
| 取組状況 | サンプル数 | スケールアップ | 横ばい・スケールダウン |
|---|---|---|---|
| 取り組んでいる | 701 | 53.8% | 46.2% |
| 取り組んでいない | 105 | 40.0% | 60.0% |
Stacked bar chart showing scale change status for companies with sales between 500 million and 1 billion yen. 53.8% of those 'taking action' and 40.0% of those 'not taking action' are doing 'Scale Up'.
資料:(株)帝国データバンク「令和6年度中小企業の経営課題と事業活動に関する調査」
(注)1. 5期前と今期見通しの売上高を比較して、第2-2-6図の売上高区分を基に、上方遷移した場合を「スケールアップ」、スケールの変動がない場合又は下方遷移した場合を「横ばい・スケールダウン」と定義している。
2. 「取り組んでいる」は、「十分取り組んでいる」、「ある程度取り組んでいる」の合計。「取り組んでいない」は、「あまり取り組んでいない」、「ほとんど取り組んでいない」の合計。