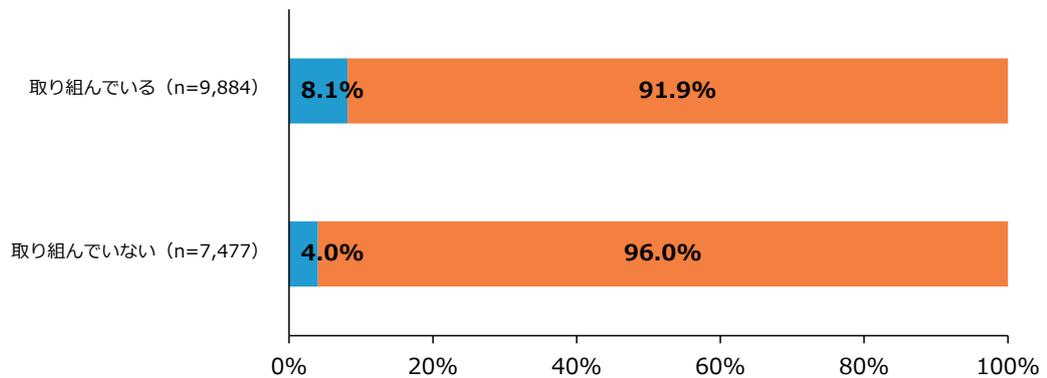
第2-2-32図 スケール変動状況(決算情報の社外開示の取組状況別)
(1) 売上高10億円未満(5期前)
| 取組状況 | サンプル数 | スケールアップ | 横ばい・スケールダウン |
|---|---|---|---|
| 取り組んでいる | 9,884 | 8.1% | 91.9% |
| 取り組んでいない | 7,477 | 4.0% | 96.0% |
Stacked bar chart showing scale change status for companies with sales under 100 million yen 5 periods ago. For companies 'taking action' (n=9,884), 8.1% achieved scale-up and 91.9% experienced horizontal or downscaling. For companies 'not taking action' (n=7,477), 4.0% achieved scale-up and 96.0% experienced horizontal or downscaling.
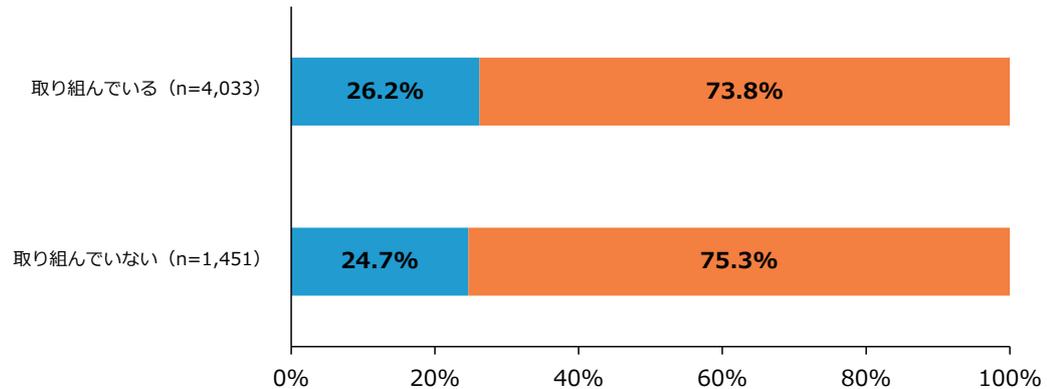
(2) 売上高10億円以上~50億円未満(5期前)
| 取組状況 | サンプル数 | スケールアップ | 横ばい・スケールダウン |
|---|---|---|---|
| 取り組んでいる | 4,033 | 26.2% | 73.8% |
| 取り組んでいない | 1,451 | 24.7% | 75.3% |
Stacked bar chart showing scale change status for companies with sales between 100 million and 500 million yen 5 periods ago. For companies 'taking action' (n=4,033), 26.2% achieved scale-up and 73.8% experienced horizontal or downscaling. For companies 'not taking action' (n=1,451), 24.7% achieved scale-up and 75.3% experienced horizontal or downscaling.
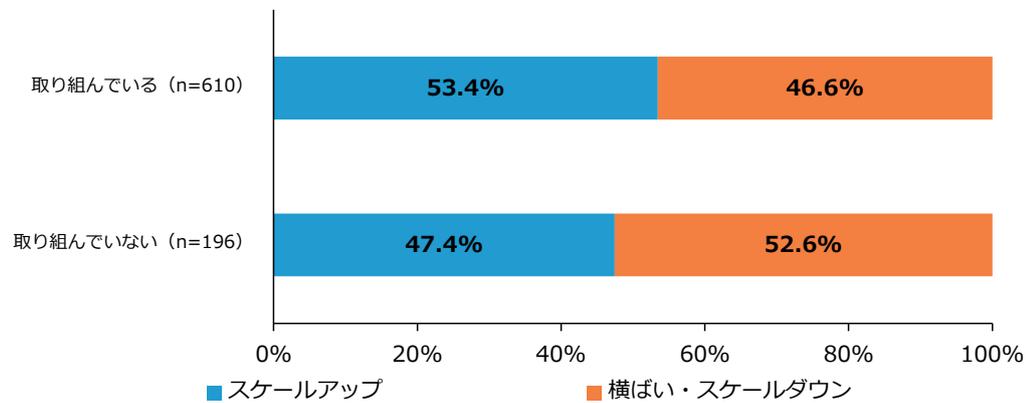
(3) 売上高50億円以上~100億円未満(5期前)
| 取組状況 | サンプル数 | スケールアップ | 横ばい・スケールダウン |
|---|---|---|---|
| 取り組んでいる | 610 | 53.4% | 46.6% |
| 取り組んでいない | 196 | 47.4% | 52.6% |
Stacked bar chart showing scale change status for companies with sales between 500 million and 1 billion yen 5 periods ago. For companies 'taking action' (n=610), 53.4% achieved scale-up and 46.6% experienced horizontal or downscaling. For companies 'not taking action' (n=196), 47.4% achieved scale-up and 52.6% experienced horizontal or downscaling.
資料:(株)帝国データバンク「令和6年度中小企業の経営課題と事業活動に関する調査」
(注)1.5期前と今期見通しの売上高を比較して、第2-2-6図の売上高区分を基に、上方遷移した場合を「スケールアップ」、スケールの変動がない場合又は下方遷移した場合を「横ばい・スケールダウン」と定義している。
2.「取り組んでいる」は、「十分取り組んでいる」、「ある程度取り組んでいる」の合計。「取り組んでいない」は、「あまり取り組んでいない」、「ほとんど取り組んでいない」の合計。
3.ここでの「社外」とは、外部株主、金融機関、支援機関、有償のコンサルタント等を指す。