ここまで、他社又は他社事業の買収に焦点を当てた分析を行ってきたが、ここからはM&Aの売り手側として自社を売却した事業者と、他社と資本提携を行った事業者について分析を進める。
第2-2-59図は、直近5年間程度において自社
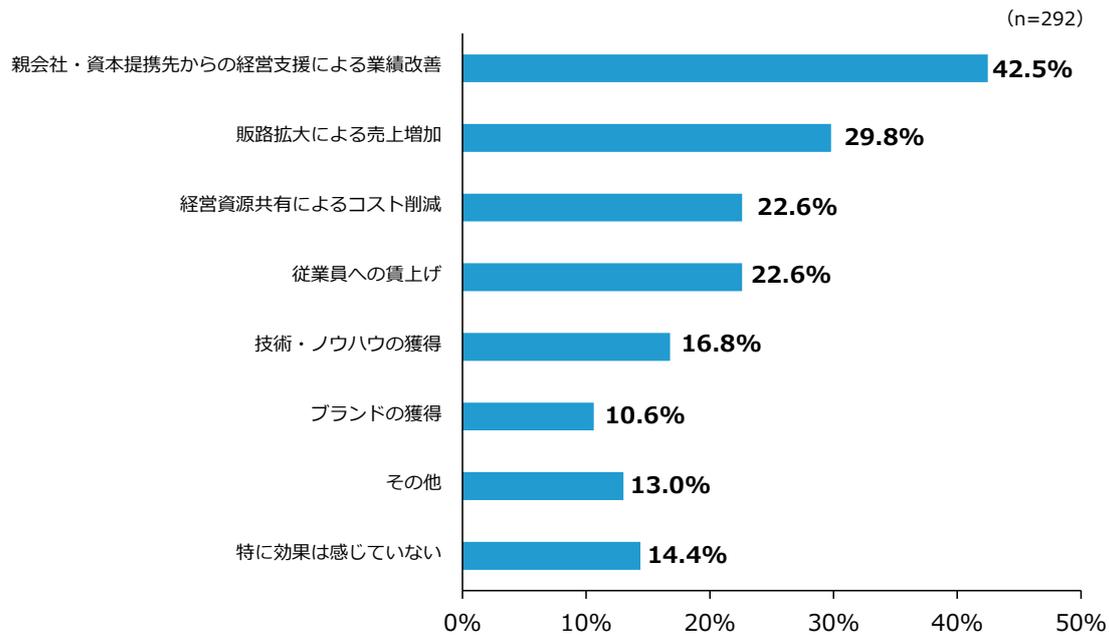
を売却した事業者を対象に、売却したことによる効果を確認したものである。これを見ると、「親会社・資本提携先からの経営支援による業績改善」と回答した割合が最も高く、次いで「販路拡大による売上増加」の割合が高いことが分かる。
第2-2-59図 自社売却による効果
| 効果 | 割合 |
|---|---|
| 親会社・資本提携先からの経営支援による業績改善 | 42.5% |
| 販路拡大による売上増加 | 29.8% |
| 経営資源共有によるコスト削減 | 22.6% |
| 従業員への賃上げ | 22.6% |
| 技術・ノウハウの獲得 | 16.8% |
| ブランドの獲得 | 10.6% |
| その他 | 13.0% |
| 特に効果は感じていない | 14.4% |
(n=292)
Horizontal bar chart showing the effects of company sales. The chart shows percentages for various effects: 42.5% for performance improvement due to management support, 29.8% for sales increase due to channel expansion, 22.6% for cost reduction due to resource sharing, 22.6% for employee wage increases, 16.8% for technology and know-how acquisition, 10.6% for brand acquisition, 13.0% for others, and 14.4% for no effect. The sample size is n=292.
資料:(株)帝国データバンク「令和6年度中小企業の経営課題と事業活動に関する調査」
(注)1.組織形態について「法人」と回答した業者に聞いたもの。
2.直近5年間程度において、「自社売却」を実施した業者に聞いたもの。ここでの「自社売却」とは、議決権過半数に当たる株式を売却することを指す。有償・無償かは問わない。
3.複数回答のため、合計は必ずしも100%にならない。