第2-2-83図は、中小企業の特許出願件数及び特許出願件数に占める中小企業割合を見たものである。これを見ると、足下の中小企業の特許出願
件数及び割合は2010年と比較すると増加傾向にあることが分かる。
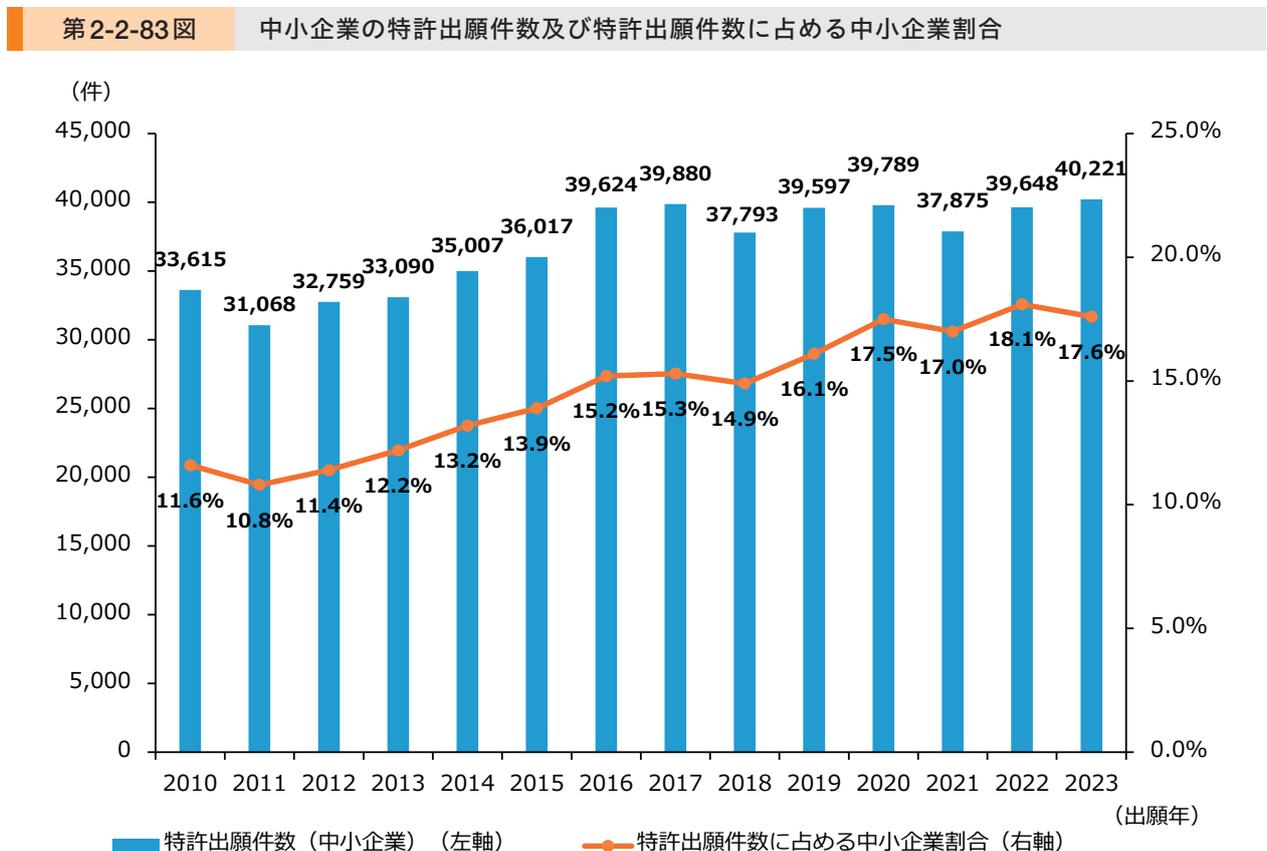
第2-2-83図 中小企業の特許出願件数及び特許出願件数に占める中小企業割合
| 出願年 | 特許出願件数 (中小企業) (左軸) | 特許出願件数に占める中小企業割合 (右軸) |
|---|---|---|
| 2010 | 33,615 | 11.6% |
| 2011 | 31,068 | 10.8% |
| 2012 | 32,759 | 11.4% |
| 2013 | 33,090 | 12.2% |
| 2014 | 35,007 | 13.2% |
| 2015 | 36,017 | 13.9% |
| 2016 | 39,624 | 15.2% |
| 2017 | 39,880 | 15.3% |
| 2018 | 37,793 | 14.9% |
| 2019 | 39,597 | 16.1% |
| 2020 | 39,789 | 17.5% |
| 2021 | 37,875 | 17.0% |
| 2022 | 39,648 | 18.1% |
| 2023 | 40,221 | 17.6% |
A combined bar and line chart showing the number of patent applications by SMEs (blue bars, left axis) and their share of total patent applications (orange line, right axis) from 2010 to 2023. The number of applications generally increases, peaking at 40,221 in 2023. The share also generally increases, peaking at 18.1% in 2022.
資料:特許庁総務部普及支援課調べ
(注) 特許出願件数は、内国人による特許出願件数である。なお、ここでの「内国人」とは、日本国内に事業所を有する企業等を指す。