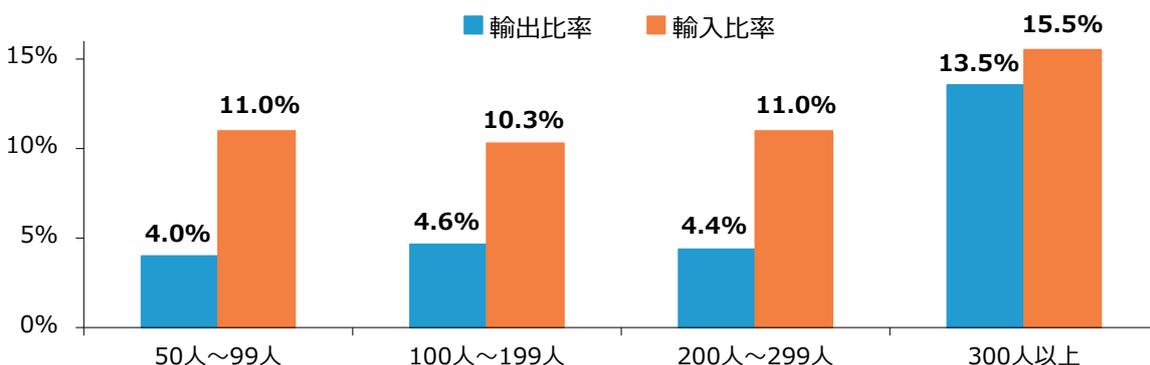
続いて、物価・為替等の動向について確認する。政策金利の上げ等に伴い、今後為替レートが円高方向に動く可能性はあるものの、歴史的な円安・輸入物価高は2024年度も継続している(第1-1-16図)。また、従業者数300人未満の企
業では、「300人以上」の企業に比べて「輸入比率」が「輸出比率」を大きく上回っており、円安に起因した輸入物価高による利益下押しの影響を受けやすいといえる(第1-1-17図)。
第1-1-16図 国内企業物価指数、消費者物価指数、輸入物価指数、ドル円相場の推移
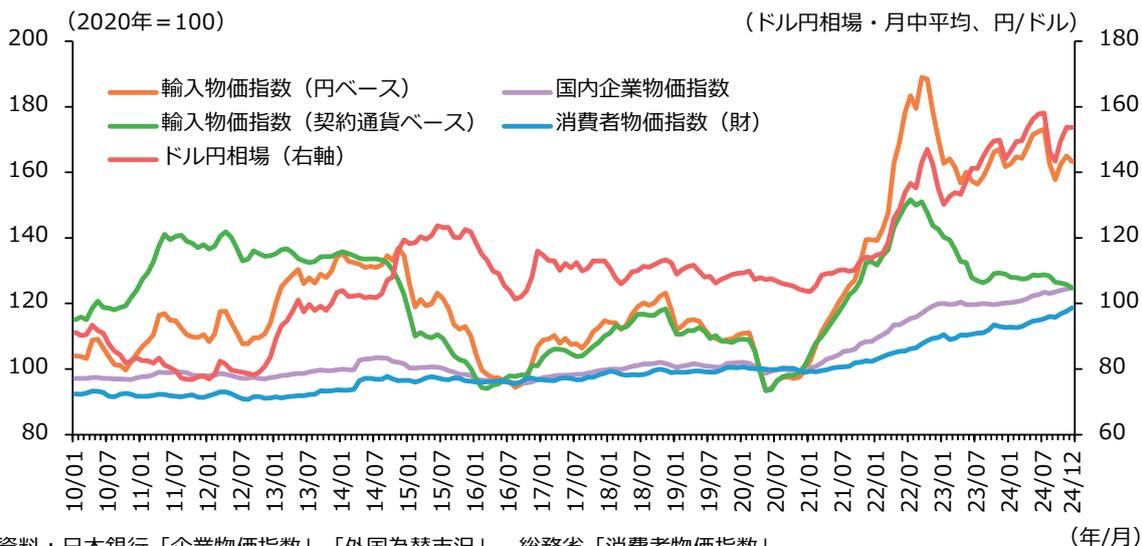
資料:日本銀行「企業物価指数」「外国為替市況」、総務省「消費者物価指数」
(注) ここでの「ドル円相場」は、「東京市場 ドル・円 スポット 中心相場/月中平均」のデータを示している。
Line chart showing the trend of domestic enterprise price index, consumer price index, import price index, and the US dollar exchange rate from 2020 to 2024. The left Y-axis represents the price index (2020=100) and the right Y-axis represents the exchange rate (Japanese Yen per US Dollar).
第1-1-17図 輸出入比率(従業者規模別)
| 従業員規模 | 輸出比率 | 輸入比率 |
|---|---|---|
| 50人~99人 | 4.0% | 11.0% |
| 100人~199人 | 4.6% | 10.3% |
| 200人~299人 | 4.4% | 11.0% |
| 300人以上 | 13.5% | 15.5% |
Bar chart showing the ratio of exports and imports by employee size. The X-axis shows employee size categories: 50-99, 100-199, 200-299, and 300 or more. The Y-axis shows the ratio from 0% to 15%.
資料:経済産業省「企業活動基本調査」
(注) 1.2023年調査(2022年度決算実績)により集計。
2.輸出比率=モノの輸出額÷売上高、輸入比率=モノの輸入額÷仕入高。