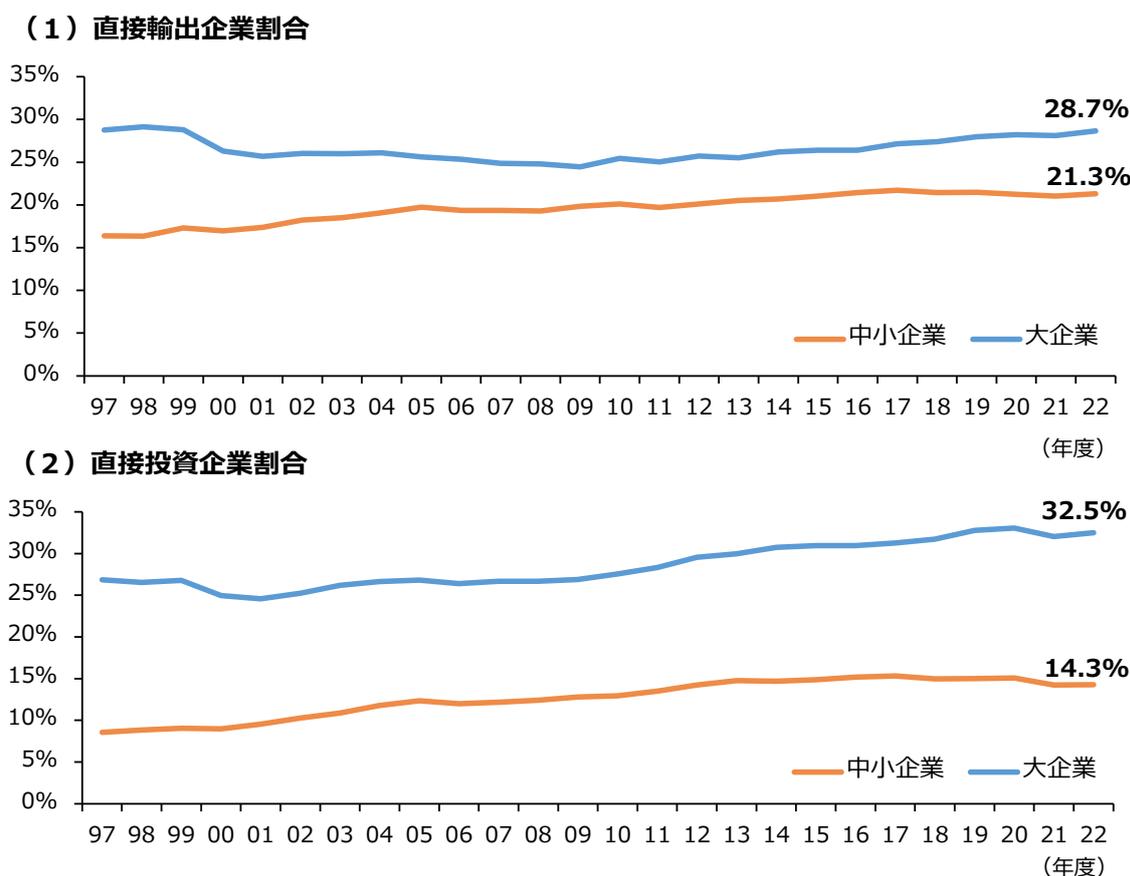
第1-1-18図は、経済産業省「経済産業省企業活動基本調査」(以下、「企業活動基本調査」という。)を用いて、企業規模別に直接輸出企業割合、直接投資企業割合の推移を見たものである。これ
を見ると、「中小企業」においては、直接輸出企業割合及び直接投資企業割合共に、1990年代の水準から上昇傾向にあるが、足下はおおむね横ばいで推移していることが分かる。
第1-1-18図 直接輸出・直接投資企業割合の推移(企業規模別)
(1) 直接輸出企業割合
| 年度 | 中小企業 (%) | 大企業 (%) |
|---|---|---|
| 97 | 16.5 | 28.5 |
| 98 | 16.5 | 28.5 |
| 99 | 17.5 | 28.5 |
| 00 | 17.0 | 26.0 |
| 01 | 17.5 | 25.5 |
| 02 | 18.0 | 25.5 |
| 03 | 18.5 | 25.5 |
| 04 | 19.0 | 25.5 |
| 05 | 19.5 | 25.5 |
| 06 | 19.0 | 25.0 |
| 07 | 19.0 | 24.5 |
| 08 | 19.0 | 24.5 |
| 09 | 19.5 | 24.0 |
| 10 | 20.0 | 25.0 |
| 11 | 19.5 | 24.5 |
| 12 | 20.0 | 25.0 |
| 13 | 20.5 | 25.0 |
| 14 | 21.0 | 26.0 |
| 15 | 21.0 | 26.0 |
| 16 | 21.5 | 26.0 |
| 17 | 22.0 | 27.0 |
| 18 | 21.5 | 27.5 |
| 19 | 21.5 | 28.0 |
| 20 | 21.5 | 28.0 |
| 21 | 21.0 | 28.5 |
| 22 | 21.3 | 28.7 |
(2) 直接投資企業割合
| 年度 | 中小企業 (%) | 大企業 (%) |
|---|---|---|
| 97 | 8.5 | 26.5 |
| 98 | 8.5 | 26.5 |
| 99 | 8.5 | 26.5 |
| 00 | 8.5 | 24.5 |
| 01 | 9.0 | 24.0 |
| 02 | 10.0 | 25.5 |
| 03 | 11.0 | 26.0 |
| 04 | 12.0 | 26.5 |
| 05 | 12.0 | 26.5 |
| 06 | 11.5 | 26.0 |
| 07 | 11.5 | 26.5 |
| 08 | 11.5 | 26.5 |
| 09 | 12.0 | 27.0 |
| 10 | 12.5 | 28.0 |
| 11 | 13.0 | 29.0 |
| 12 | 14.0 | 29.5 |
| 13 | 14.5 | 30.5 |
| 14 | 14.5 | 31.0 |
| 15 | 14.5 | 31.0 |
| 16 | 15.0 | 31.0 |
| 17 | 15.0 | 31.5 |
| 18 | 14.5 | 32.0 |
| 19 | 14.5 | 32.5 |
| 20 | 14.5 | 32.5 |
| 21 | 14.0 | 32.0 |
| 22 | 14.3 | 32.5 |
Two line charts showing the percentage of companies directly exporting and directly investing, comparing SMEs (orange line) and large enterprises (blue line) from 1997 to 2022. Chart (1) shows Direct Export Ratio, and Chart (2) shows Direct Investment Ratio.
資料:経済産業省「企業活動基本調査」再編加工
(注) 1.ここで「直接輸出企業」とは、直接外国企業との取引を行う企業である。
2.ここで「直接投資企業」とは、海外子会社を保有している企業である。
3.ここで「中小企業」は、経年での接続性を担保するため、各業種において下記の定義を用いている。
- ・製造業その他:資本金の額又は出資の総額が3億円以下又は常時使用する従業員の数300人以下。
- ・卸売業:資本金の額又は出資の総額が1億円以下又は常時使用する従業員の数100人以下。
- ・小売業:資本金の額又は出資の総額が5千万円以下又は常時使用する従業員の数50人以下。
- ・サービス業:資本金の額又は出資の総額が5千万円以下又は常時使用する従業員の数100人以下。