ここからは、雇用者数の増減の推移について確認する。
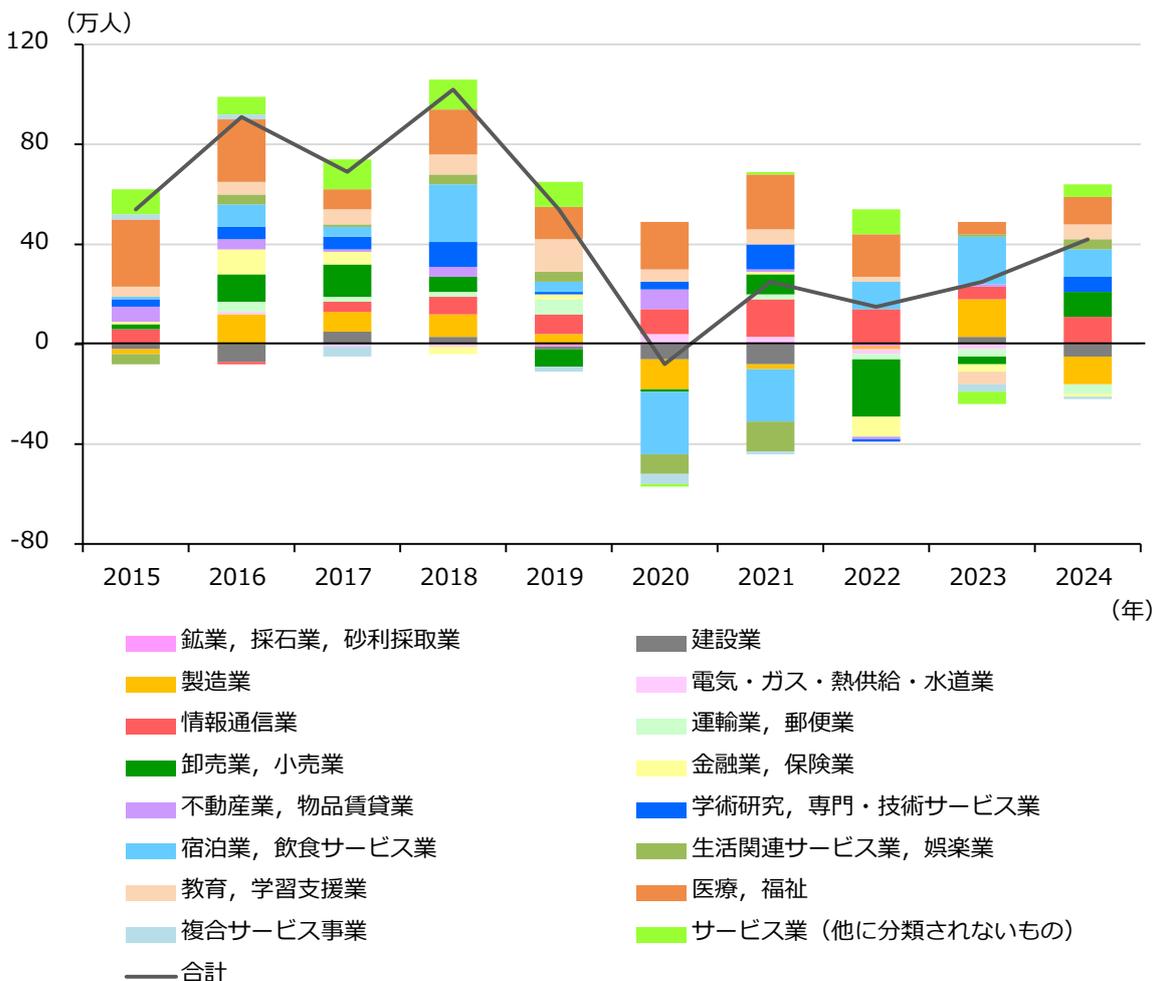
まず、雇用者数の増減の推移を見ると、2024年の「合計」は前年比で増加している。産業別に
見ると「情報通信業」、「宿泊業、飲食サービス業」、「医療、福祉」の増加幅が大きく、「製造業」の減少幅が大きいことが分かる(第1-1-26図)。
第1-1-26図 雇用者数の増減の推移(前年比、産業別)
| 産業 | 2015 | 2016 | 2017 | 2018 | 2019 | 2020 | 2021 | 2022 | 2023 | 2024 |
|---|---|---|---|---|---|---|---|---|---|---|
| 製造業 | 30 | 40 | 30 | 40 | 20 | -40 | -20 | -30 | -10 | -10 |
| 情報通信業 | 5 | 10 | 10 | 15 | 10 | 10 | 15 | 10 | 10 | 15 |
| 宿泊業、飲食サービス業 | 10 | 15 | 15 | 20 | 10 | -10 | 10 | 10 | 10 | 15 |
| 医療、福祉 | 10 | 15 | 15 | 20 | 10 | 10 | 15 | 10 | 10 | 15 |
| 合計 | 50 | 90 | 70 | 100 | 50 | -10 | 20 | 10 | 20 | 40 |
Stacked bar chart showing the year-on-year change in employment by industry from 2015 to 2024. The Y-axis represents the number of people in thousands, ranging from -80 to 120. The X-axis represents the years. The chart shows a general downward trend in total employment change from 2018 to 2020, followed by a recovery. Information communication, accommodation, and food service industries show significant growth, while manufacturing shows a significant decline.
資料:総務省「労働力調査(基本集計)」
(注)1.「合計」については、各系列の合計となっており、雇用者総数とは異なる。
2.2020年国勢調査結果に基づく推計人口をベンチマークとして遡及又は補正した時系列接続用数値を用いている。