第4節 労働生産性・設備投資
本節では、労働生産性・設備投資の動向について確認する。
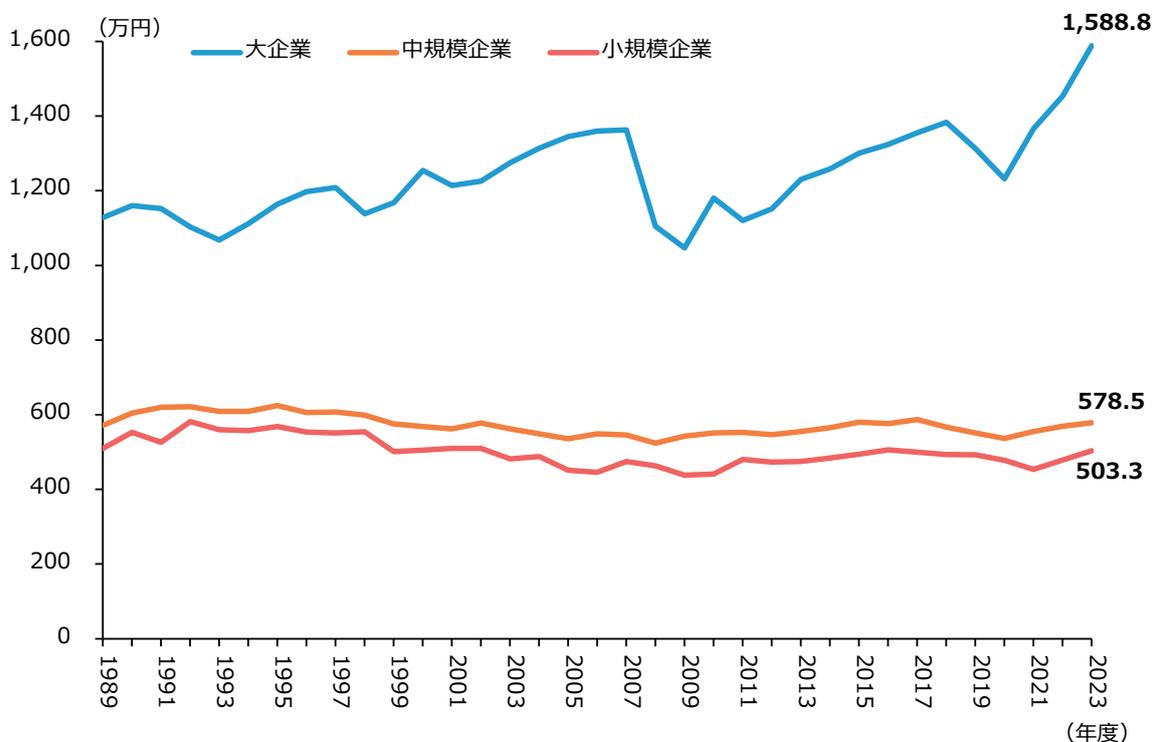
第1-1-31図は、企業規模別に労働生産性(従業員一人当たり付加価値額)の推移を見たものである。これを見ると、「大企業」では増加傾向にあるが、「中規模企業」、「小規模企業」ではおお
むね横ばいが続いており、約30年前と比較すると緩やかに減少している。
また、中小企業の労働生産性の推移を業種別に見ると、多くの業種において横ばいの傾向で推移しており、特にサービス業の伸びは小さい傾向にある(第1-1-32図)。
第1-1-31図 労働生産性の推移(企業規模別)
| 年 | 大企業 (万円) | 中規模企業 (万円) | 小規模企業 (万円) |
|---|---|---|---|
| 1989 | 1,120 | 580 | 520 |
| 1991 | 1,150 | 610 | 550 |
| 1993 | 1,080 | 600 | 550 |
| 1995 | 1,180 | 610 | 560 |
| 1997 | 1,200 | 600 | 550 |
| 1999 | 1,150 | 580 | 500 |
| 2001 | 1,250 | 570 | 500 |
| 2003 | 1,280 | 580 | 500 |
| 2005 | 1,350 | 540 | 450 |
| 2007 | 1,360 | 550 | 480 |
| 2009 | 1,050 | 540 | 430 |
| 2011 | 1,120 | 550 | 480 |
| 2013 | 1,220 | 550 | 480 |
| 2015 | 1,300 | 580 | 500 |
| 2017 | 1,380 | 580 | 500 |
| 2019 | 1,300 | 550 | 480 |
| 2021 | 1,150 | 540 | 450 |
| 2023 | 1,588.8 | 578.5 | 503.3 |
Line graph showing the trend of labor productivity (Value Added per Employee) by company size from 1989 to 2023. The Y-axis represents Value Added per Employee in ten thousand yen (0 to 1,600). The X-axis represents the year (1989 to 2023). Three lines are shown: Large Enterprises (blue), Medium Enterprises (orange), and Small Enterprises (red). Large Enterprises show a significant increase, especially after 2020, reaching 1,588.8 in 2023. Medium and Small Enterprises show relatively stable, slightly declining trends, ending at 578.5 and 503.3 respectively in 2023.
資料:財務省「法人企業統計調査年報」
(注)1.ここでの大企業とは資本金10億円以上の企業、中規模企業とは資本金1千万円以上1億円未満、小規模企業とは資本金1千万円未満の企業とする。
2.金融業、保険業は含まれていない。
3.労働生産性は「従業員一人当たり付加価値額」、付加価値額=営業純益(営業利益-支払利息等)+人件費+支払利息等+動産・不動産賃借料+租税公課。