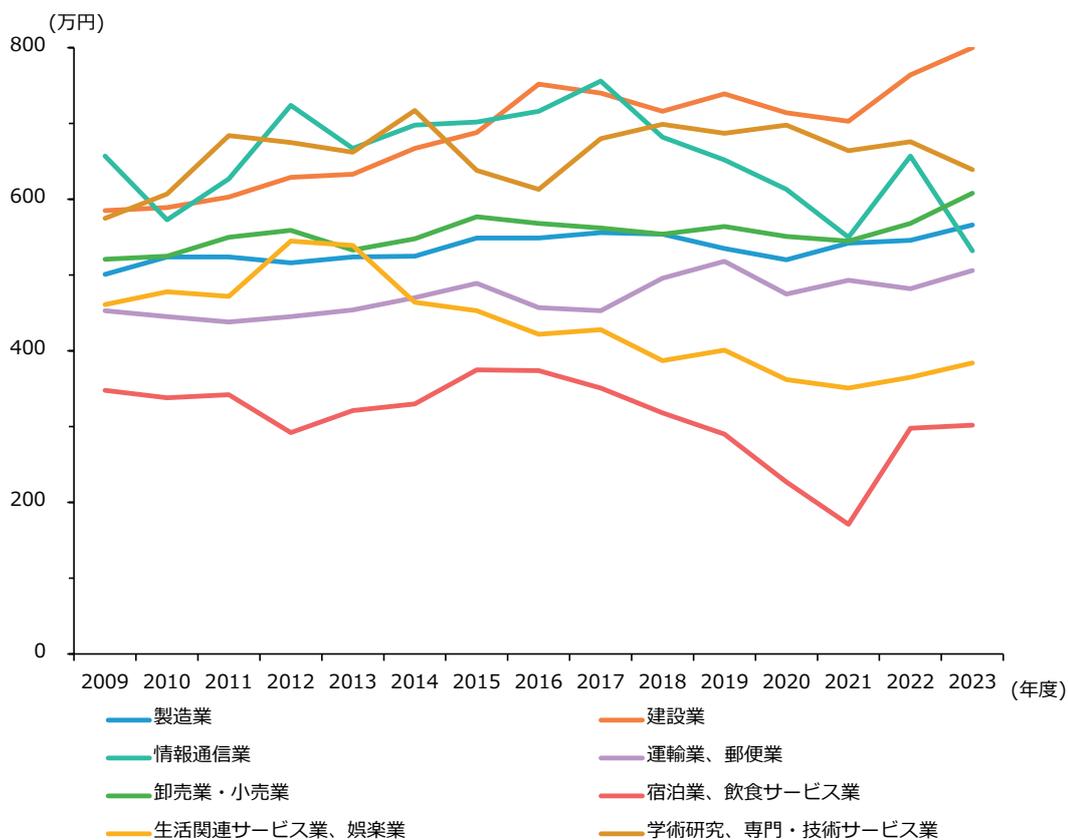
第1-1-32図 中小企業における労働生産性の推移(業種別)
| 業種 | 2009 | 2010 | 2011 | 2012 | 2013 | 2014 | 2015 | 2016 | 2017 | 2018 | 2019 | 2020 | 2021 | 2022 | 2023 |
|---|---|---|---|---|---|---|---|---|---|---|---|---|---|---|---|
| 建設業 | 580 | 600 | 680 | 650 | 650 | 700 | 680 | 750 | 750 | 700 | 730 | 700 | 700 | 750 | 800 |
| 情報通信業 | 650 | 580 | 620 | 720 | 650 | 680 | 700 | 700 | 750 | 680 | 650 | 600 | 550 | 650 | 550 |
| 卸売業・小売業 | 520 | 530 | 550 | 560 | 530 | 550 | 580 | 570 | 560 | 560 | 570 | 550 | 550 | 580 | 600 |
| 運輸業・郵便業 | 450 | 440 | 430 | 440 | 450 | 460 | 480 | 450 | 450 | 480 | 500 | 470 | 480 | 480 | 500 |
| 宿泊業・飲食サービス業 | 350 | 340 | 340 | 290 | 320 | 330 | 380 | 380 | 350 | 320 | 290 | 220 | 170 | 300 | 300 |
| 生活関連サービス業、娯楽業 | 460 | 480 | 470 | 550 | 530 | 460 | 450 | 420 | 420 | 390 | 400 | 360 | 350 | 370 | 380 |
| 学術研究、専門・技術サービス業 | 580 | 600 | 680 | 680 | 650 | 700 | 630 | 610 | 680 | 700 | 680 | 700 | 660 | 670 | 640 |
Line chart showing the trend of labor productivity (in 10,000 yen) for various industries in small and medium enterprises from 2009 to 2023. The chart shows that Construction (建設業) generally has the highest productivity, while Accommodation and Food Service (宿泊業・飲食サービス業) has the lowest. Most industries show a general upward trend, with a notable dip in 2020.
資料:財務省「法人企業統計調査年報」
(注)1. 資本金1億円未満の企業について集計したもの。
2. 労働生産性は「従業員一人当たり付加価値額」、付加価値額=営業純益(営業利益-支払利息等)+人件費+支払利息等+動産・不動産賃借料+租税公課。
第1節
第2節
第3節
第4節
第5節
第6節
第7節
第8節
第9節