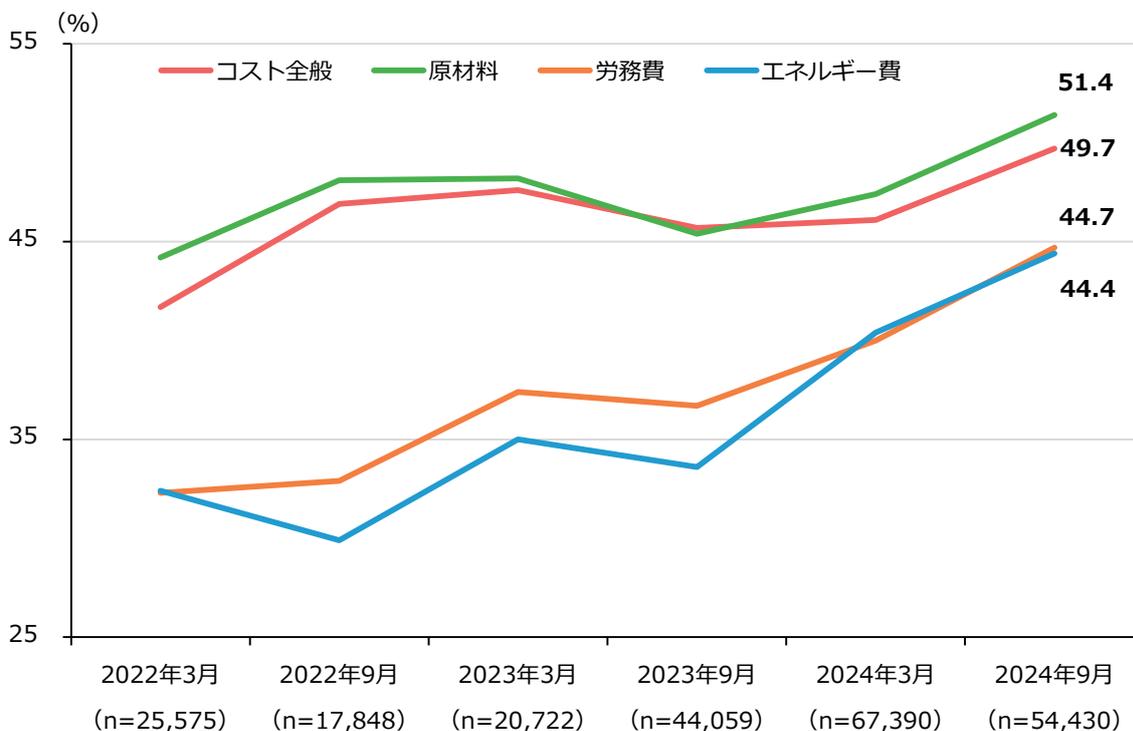
第1-1-49図は、2022年から2024年におけるコスト全般及各コストの変動に対する価格転嫁率の推移を見たものである。各コストの転嫁率は
上昇傾向であり、「コスト全般」の転嫁率は直近で5割程度まで上昇しているが、更なる価格転嫁の実現が期待される。
第1-1-49図 各コストの変動に対する価格転嫁率の推移
| 調査時期 | サンプル数 (n) | コスト全般 (%) | 原材料 (%) | 労務費 (%) | エネルギー費 (%) |
|---|---|---|---|---|---|
| 2022年3月 | 25,575 | 41.5 | 44.0 | 32.5 | 32.5 |
| 2022年9月 | 17,848 | 47.0 | 48.0 | 33.0 | 30.0 |
| 2023年3月 | 20,722 | 48.0 | 48.0 | 37.0 | 35.0 |
| 2023年9月 | 44,059 | 45.5 | 45.5 | 36.5 | 33.5 |
| 2024年3月 | 67,390 | 46.0 | 47.0 | 40.0 | 40.0 |
| 2024年9月 | 54,430 | 49.7 | 51.4 | 44.7 | 44.4 |
Line chart showing the trend of price pass-through rates for various costs from March 2022 to September 2024. The Y-axis represents the pass-through rate in percentage (25% to 55%). The X-axis shows time points with sample sizes. Four lines represent: Total Cost (red), Raw Materials (green), Labor Costs (orange), and Energy Costs (blue). All lines show an upward trend, with Raw Materials reaching the highest rate of 51.4% by September 2024.
資料:中小企業庁「価格交渉促進月間フォローアップ調査」
(注) 1. 2022年3月、2022年9月、2023年3月、2023年9月、2024年3月、2024年9月の調査における、価格転嫁率の平均値を算出したもの。
2. ここでの価格転嫁率とは、主要な発注側企業(最大3社)との間で、直近6か月間のコスト上昇分のうち、何割を価格転嫁できたかの回答を集計したもの。